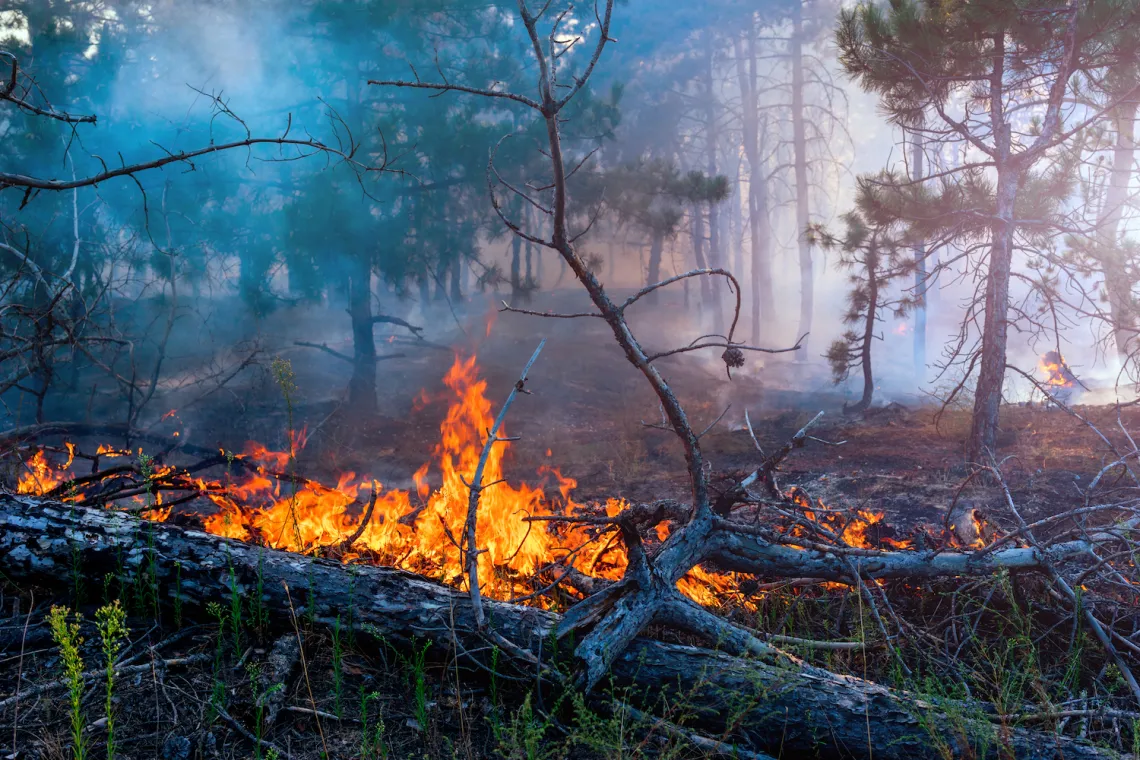
Image Source: University of Arizona Research
Every year, wildfires consume millions of acres across the United States, threatening lives, property, and ecosystems. But behind each flame is a data point—a record that tells us when it started, what caused it, how big it grew, and who responded. This project analyzes 1.88 million geo-referenced wildfire records spanning 24 years (1992–2015), representing over Over 140 million acres of land were destroyed by wildfires.
Dataset Source: 1.88 Million US Wildfires - Kaggle
This isn't just numbers in a spreadsheet. It's a comprehensive archive of environmental disaster, human impact, and response efforts across two decades. The dataset captures:
- Scale: Millions of records tracking fires from small brush burns to catastrophic blazes
- Geospatial Richness: Precise latitude/longitude coordinates, state, county, and land ownership details
- Cause Classification: Detailed breakdown of human vs. natural ignition sources
- Multi-Agency Data: Federal, state, local, and tribal fire management records unified in one place
This scale and complexity make it perfect for demonstrating real-world data analytics skills—from handling messy raw data to delivering polished, interactive dashboards.
Our analysis focuses on answering critical questions about wildfire patterns and their implications, using the available dataset (1992–2015, 1.88M records). Each question is designed to provide actionable insights that benefit stakeholders, including policymakers, environmental agencies, and community leaders.
- How have wildfire frequency and severity changed over 24 years?
- Are large, catastrophic fires becoming more common?
- Which months and seasons pose the greatest fire risk?
Stakeholder Benefit: Identifies long-term trends and seasonal risks, guiding prevention campaigns and resource allocation.
- Which states and counties face the highest wildfire risk?
- How does fire behavior differ between regions?
- Where should fire prevention resources be concentrated?
Stakeholder Benefit: Pinpoints geographic hotspots, helping direct funding and manpower to the most vulnerable areas.
- What are the leading causes of wildfires?
- How do human-caused fires differ from natural ignitions?
- Which causes vary by season or geography?
Stakeholder Benefit: Differentiates human vs natural causes, enabling targeted prevention strategies (e.g., campfire safety vs lightning monitoring).
- How does land ownership (federal, state, private, tribal) affect fire occurrence?
- Which agencies respond most effectively?
- Has containment efficiency improved over time?
- Which agencies handle the largest workloads, and how does this affect performance?
Stakeholder Benefit: Evaluates agency accountability and efficiency, supporting better resource planning and policy decisions.
- What’s the total environmental and economic cost of wildfires?
- Can we identify conditions that predict large fires?
- What patterns emerge for future prevention strategies?
- Do certain counties experience repeated fires (recurrence), and what does this mean for long-term management?
Stakeholder Benefit: Quantifies damage, highlights predictive risk factors, and supports long-term investment in prevention and recovery.
- Lightweight exploration of small subsets of the dataset
- PivotTables for quick summaries (fire counts by year, state, cause)
- Conditional formatting to highlight hotspots
- Documentation of cleaning and transformation decisions
Note: Excel is used primarily for exploration and documentation. Large-scale analysis is handled in SQL and Power BI.
- Complex queries for trend analysis and aggregations
- Fire size classification and cause breakdowns
- Multi-table joins for agency and ownership analysis
- Performance optimization for 1.88M records
- Interactive geographic heat maps
- Time-series visualizations of fire trends
- Drill-down capabilities by region, cause, and ownership
- User-friendly interface for non-technical stakeholders
- Synthesizing technical findings into actionable insights
- Clear narrative connecting data to real-world impact
- Helping stakeholders understand problems, evaluate solutions, and gain data-driven insights for better decision-making
By the end of this analysis, we'll have:
- ✅ Clear Evidence of how wildfire patterns have evolved over 24 years
- ✅ Geographic Risk Maps identifying high-priority regions for prevention
- ✅ Cause Analysis revealing the role of human activity vs. natural factors
- ✅ Management Insights comparing effectiveness across agencies and land types
- ✅ Professional Dashboard communicating findings to both technical and non-technical audiences
Our workflow combines core analytics platforms with supporting environments and assistants to ensure efficiency, reproducibility, and clear stakeholder communication.
- Excel → Lightweight exploration of small subsets, PivotTables for quick summaries, conditional formatting for hotspots, and documentation of cleaning decisions
- PostgreSQL → Robust database management, complex queries, and aggregations across 1.88M records
- SQL → Data extraction, transformation, and analysis for trend, cause, and ownership breakdowns
- Power BI → Interactive dashboards, geospatial visualizations, and user-friendly interfaces for non-technical stakeholders
- VS Code → Development environment for SQL/Python scripting, workflow reproducibility, and version control integration
- DB Browser → Quick schema inspection and lightweight database management for SQLite/PostgreSQL
- AI Assistants (Claude, Microsoft Copilot, Perplexity) → Supporting productivity, documentation drafting, brainstorming, and stakeholder communication
This distinction highlights the core tools that drive the analysis and the supporting tools that enhance productivity, transparency, and storytelling for stakeholders.
📂 us-wildfires-analysis
│
├── 📁 data
│   ├── raw/              → Original CSV dataset
│   └── processed/        → Cleaned data exports for analysis
│
├── 📁 sql
│   ├── queries/          → Production SQL scripts
│   └── exploration/      → Development and testing queries
│
├── 📁 excel
│   ├── pivot_tables.xlsx → Exploratory summaries
│   └── cleaning_log.xlsx → Data preparation documentation
│
├── 📁 dashboards
│   ├── powerbi/          → Power BI project files (.pbix)
│   └── screenshots/      → Dashboard images for documentation
│
├── 📁 docs
│   ├── data_prep.md      → Technical preparation details
│   └── analysis_report.md → Final insights and recommendations
│
└── README.md             → This file
| Column | Meaning (Simplified) | Abbreviation | Analytical Benefit |
|---|---|---|---|
| objectid | Internal row number | — | Ensures data integrity and indexing |
| fod_id | Unique fire identifier | FOD | Primary key for joins; guarantees uniqueness |
| fpa_id | Agency-specific fire ID | FPA | Links to original agency reports |
| source_system_type | Type of reporting system (Federal, State, Local) | — | Categorizes reporting sources |
| source_system | Name of reporting system | — | Filters by reporting platform |
| nwcg_reporting_agency | Agency code (NWCG standard) | NWCG | Groups fires by reporting agency |
| nwcg_reporting_unit_id | Reporting unit identifier | Unit ID | Connects fires to nwcg_units table |
| nwcg_reporting_unit_name | Reporting unit name | — | Shows which unit handled the fire |
| source_reporting_unit | Source unit code | — | Validates consistency with NWCG data |
| source_reporting_unit_name | Source unit name | — | Adds clarity for non-technical readers |
| local_fire_report_id | Local fire report ID | — | Links to local documentation |
| local_incident_id | Local incident ID | — | Tracks incidents at local level |
| fire_code | Fire tracking code | — | Connects to ICS/agency systems |
| fire_name | Fire name | — | Easier storytelling in dashboards |
| ics_209_incident_number | ICS-209 incident number | ICS | Connects to national incident system |
| ics_209_name | ICS-209 incident name | — | Adds clarity for stakeholders |
| mtbs_id | Burn severity program ID | MTBS | Links to MTBS severity analysis |
| mtbs_fire_name | MTBS fire name | — | Adds clarity for severity studies |
| complex_name | Fire complex name | — | Groups multi-fire complexes |
| fire_year | Year fire discovered | — | Tracks long-term wildfire trends |
| discovery_date | Julian discovery date | — | Raw date storage |
| discovery_date_greg | Converted Gregorian date | — | Readable calendar dates |
| discovery_doy | Day of year discovered | DOY | Identifies seasonal fire patterns |
| discovery_time | Time of day discovered | — | Shows detection speed |
| stat_cause_code | Numeric cause code | — | Enables statistical cause breakdown |
| stat_cause_descr | Cause description | — | Differentiates human vs natural causes |
| cont_date | Julian containment date | — | Raw date storage |
| cont_date_greg | Converted Gregorian containment date | — | Measures containment speed |
| cont_doy | Day of year contained | DOY | Shows containment timing |
| cont_time | Time of day contained | — | Evaluates agency efficiency |
| fire_size | Final fire size (in acres) | — | Quantifies damage |
| fire_size_class | Fire size class (A–G) | — | Simplifies communication of fire magnitude |
| latitude | Latitude (NAD83) | — | Maps fire locations |
| longitude | Longitude (NAD83) | — | Maps fire locations |
| owner_code | Land ownership code | — | Categorizes ownership impact |
| owner_descr | Land ownership description | — | Shows federal vs private land impact |
| state | Two-letter state code | — | Identifies state-level fire trends |
| county | County name | — | Identifies county-level hotspots |
| fips_code | County FIPS code | FIPS | Enables joins with census data |
| fips_name | County FIPS name | — | Adds clarity for non-technical readers |
| shape | Geometry placeholder | — | Supports advanced GIS analysis |
| Column | Meaning (Simplified) | Abbreviation | Analytical Benefit |
|---|---|---|---|
| unit_id | Unique unit identifier | — | Primary key; ensures uniqueness |
| unit_name | Full name of reporting unit | — | Stakeholders recognize agency names |
| unit_type | Type of unit (Forest, District, County, etc.) | — | Shows organizational structure |
| agency_code | Agency code (e.g., FS, BLM) | — | Groups and compares performance |
| state | State code | — | Identifies state-level unit distribution |
| unit_code | Short code for unit | — | Links fires to reporting units |
| unit_description | Description of unit | — | Adds context for stakeholders |
| region | Geographic region | — | Shows distribution of fire management responsibilities |
Out of all the tables in the dataset, we selected fires and nwcg_units because they form the core backbone of wildfire analysis:
firestable: Contains the detailed incident‑level records (dates, causes, sizes, locations, ownership). It is the primary source for trend analysis, geospatial mapping, and cause/impact studies. Without this table, we cannot answer fundamental questions about wildfire frequency, scale, or impact.nwcg_unitstable: Provides the organizational context (which agency or unit reported the fire). It allows us to connect incidents to specific reporting bodies, enabling performance comparisons, accountability analysis, and regional breakdowns.
Together, these two tables bridge incident data with organizational responsibility, giving stakeholders a complete picture: not just where and when fires occurred, but also who reported them and how they were managed. This makes them the most valuable pair for both technical analysis and stakeholder storytelling.
To efficiently manage and query the US Wildfires dataset (1.88M records), we designed a PostgreSQL database with two core tables: fires and nwcg_units. These tables are linked via a one-to-many relationship, allowing us to connect each wildfire incident to the unit that reported it.
CREATE TABLE fires (
    objectid INT,
    fod_id BIGINT PRIMARY KEY,
    fpa_id TEXT,
    source_system_type TEXT,
    source_system TEXT,
    nwcg_reporting_agency TEXT,
    nwcg_reporting_unit_id TEXT,
    nwcg_reporting_unit_name TEXT,
    source_reporting_unit TEXT,
    source_reporting_unit_name TEXT,
    local_fire_report_id TEXT,
    local_incident_id TEXT,
    fire_code TEXT,
    fire_name TEXT,
    ics_209_incident_number TEXT,
    ics_209_name TEXT,
    mtbs_id TEXT,
    mtbs_fire_name TEXT,
    complex_name TEXT,
    fire_year INT,
    discovery_date NUMERIC,
    discovery_doy NUMERIC,
    discovery_time TEXT,
    stat_cause_code NUMERIC,
    stat_cause_descr TEXT,
    cont_date NUMERIC,
    cont_doy NUMERIC,
    cont_time TEXT,
    fire_size NUMERIC,
    fire_size_class CHAR(1),
    latitude NUMERIC(10,6),
    longitude NUMERIC(10,6),
    owner_code NUMERIC,
    owner_descr TEXT,
    state CHAR(2),
    county TEXT,
    fips_code TEXT,
    fips_name TEXT,
    shape TEXT
);CREATE TABLE nwcg_units (
unit_id TEXT PRIMARY KEY,
unit_name TEXT,
unit_type TEXT,
agency_code TEXT,
state CHAR(2),
unit_code TEXT,
unit_description TEXT,
region TEXT
);COPY fires
FROM 'D:/Projects/Capstone/CSV/Fires.csv'
DELIMITER ','
CSV HEADER;
COPY nwcg_units
FROM 'D:/Projects/Capstone/CSV/NWCG_Units.csv'
DELIMITER ','
CSV HEADER;erDiagram
FIRES }o--|| NWCG_UNITS : "reported_by"
FIRES {
bigint fod_id PK
text nwcg_reporting_unit_id FK
int objectid
text fpa_id
text source_system_type
text source_system
text nwcg_reporting_agency
text nwcg_reporting_unit_name
text source_reporting_unit
text source_reporting_unit_name
text local_fire_report_id
text local_incident_id
text fire_code
text fire_name
text ics_209_incident_number
text ics_209_name
text mtbs_id
text mtbs_fire_name
text complex_name
int fire_year
numeric discovery_date
numeric discovery_doy
text discovery_time
numeric stat_cause_code
text stat_cause_descr
numeric cont_date
numeric cont_doy
text cont_time
numeric fire_size
char fire_size_class
numeric latitude
numeric longitude
numeric owner_code
text owner_descr
char state
text county
text fips_code
text fips_name
text shape
}
NWCG_UNITS {
text unit_id PK
text unit_name
text unit_type
text agency_code
char state
text unit_code
text unit_description
text region
}
| Relationship | Type | Description |
|---|---|---|
| FIRES → NWCG_UNITS | Many-to-One | Each fire is reported by one NWCG unit; each unit can report multiple fires |
| Foreign Key | nwcg_reporting_unit_id |
Links fires to their reporting units |
- Primary Keys:
fod_id(fires) andunit_id(nwcg_units) ensure data integrity - Geospatial Data:
latitude,longitudeenable mapping and spatial analysis - Temporal Data: Multiple date fields support comprehensive trend analysis
- Classification:
fire_size_class,stat_cause_descr,owner_descrenable categorical breakdown - Organizational Context: Foreign key relationship connects incidents to responsible agencies
- Data Quality: Removing redundant columns improves maintainability and performance
Working with real-world data is never straightforward. Our dataset arrived as a massive CSV file with 39 columns and 1,880,456 rows—far too large for Excel, filled with inconsistent formats, and spanning multiple reporting systems across decades.
| Attribute | Value |
|---|---|
| Source File | Fires.csv |
| Total Records | 1,880,456 |
| Time Coverage | 1992–2015 (24 years) |
| Total Columns | 39 |
| Key Data Types | Julian dates, geolocation, fire metadata, agency codes |
The Issue: Date fields arrived as cryptic numbers like 2453403.5 instead of readable dates like 2005-01-15.
These are Julian day numbers—a continuous count of days since January 1, 4713 BC, commonly used in astronomy and scientific applications. While useful for calculations, they're incompatible with PostgreSQL's DATE type.
The Impact: Our initial schema defined discovery_date and cont_date as DATE, causing immediate import failures.
The Solution:
- Redefined both fields as
NUMERICto accept the raw values - Created helper columns
discovery_date_gregandcont_date_greg - Converted Julian dates to Gregorian calendar dates using PostgreSQL's timestamp arithmetic:
UPDATE fires
SET discovery_date_greg = (TIMESTAMP '4713-01-01 BC' + (discovery_date || ' days')::interval),
    cont_date_greg = (TIMESTAMP '4713-01-01 BC' + (cont_date || ' days')::interval);
Why This Matters: Now we can filter by year, month, and season—essential for identifying temporal patterns.
The Issue: Fields like STAT_CAUSE_CODE, OWNER_CODE, and DISCOVERY_DOY contained values like 9.0 instead of 9.
These should logically be integers (you can't have 9.5 as a cause code), but the source data included decimal points, likely due to how different agencies exported their records.
The Impact: PostgreSQL's INT type rejected these values, halting the import.
The Solution: Redefined all affected columns as NUMERIC to accommodate the decimal formatting, while maintaining the ability to query them as categorical variables.
Lesson Learned: Never assume data types match logical expectations—always validate against the actual source data.
The Issue: Our initial schema had 35 columns. The CSV file had 39.
The Impact: PostgreSQL's COPY command failed with the error: "extra data after last expected column"
The Solution: Carefully matched every column in the schema to the CSV header, accounting for all 39 fields—even those we might not use in analysis.
Takeaway: When importing large datasets, schema accuracy is non-negotiable. One missing column can derail the entire process.
After successfully importing all records, we validated the data quality:
| Validation Check | Result | Status |
|---|---|---|
| Total Records | 1,880,456 | ✅ Complete |
| Year Range | 1992–2015 | ✅ Expected span |
| Julian Date Range | 2448622.5 – 2457387.5 | ✅ Valid |
| Fire Size Classes | A–G | ✅ All categories present |
| Owner Codes | 0.0–15.0 | ✅ Within expected range |
| Date Conversion | Spot-checked 100 records | ✅ Accurate Gregorian dates |
Sample Conversion Verification:
- Julian
2453403.5→2005-01-15✓ - Julian
2457387.5→2015-12-31✓ - Julian
2448622.5→1992-01-01✓
stat_cause_code- Redundant: Numeric version ofstat_cause_descrowner_code- Redundant: Numeric version ofowner_descrnwcg_reporting_agency- Redundant: Can be joined fromnwcg_units.agency_codenwcg_reporting_unit_name- Redundant: Can be joined fromnwcg_units.unit_namesource_reporting_unit- Redundant: Duplicate ofnwcg_reporting_unit_idsource_reporting_unit_name- Redundant: Duplicate of unit namefips_name- Redundant: Duplicate ofcountyfield
unit_code- Redundant: Duplicate/similar tounit_id
- All numeric codes that have corresponding text descriptions (
stat_cause_code,owner_code) - Redundant agency/unit name fields that can be retrieved via JOIN operations
source_reporting_unitandsource_reporting_unit_name(duplicates of NWCG fields)fips_name(already represented bycounty)unit_codefrom NWCG_UNITS table
- ✅ Reduced storage footprint (~15-20% size reduction)
- ✅ Faster query performance (fewer columns to scan)
- ✅ Simplified data model for stakeholders
- ✅ Reduced data redundancy and update anomalies
- ✅ Clearer foreign key relationships
- Create indexes on:
fire_year,state,fire_size_class,stat_cause_descr,nwcg_reporting_unit_id - Create composite index on: (
state,fire_year) for state-level time-series queries - Create spatial index on: (
latitude,longitude) for geospatial queries
With 1.88 million records successfully imported and validated, we're ready for the next critical phase. Our data cleaning will focus on:
- Identify patterns in missing data (are certain agencies or years incomplete?)
- Decide on imputation vs. exclusion strategies
- Document all decisions for reproducibility
- Ensure consistent naming conventions across agencies
- Consolidate duplicate categories (e.g., "Federal" vs. "FEDERAL")
- Create clean lookup tables for cause codes and ownership types
- Verify latitude/longitude coordinates fall within US boundaries
- Cross-reference state codes with geolocation
- Flag and investigate anomalies
- Extract month, season, and day-of-week from dates
- Calculate fire duration (discovery date to containment date)
- Create binary flags (human-caused vs. natural, federal vs. non-federal land)
- Export cleaned subsets for Excel exploration
- Create indexed views for common queries
- Build aggregation tables to improve Power BI performance
This analysis will demonstrate:
- ✅ Data Engineering: Handling 1.88M records from raw import to analysis-ready
- ✅ SQL Proficiency: Complex queries, joins, and aggregations on real-world data
- ✅ Excel Skills: PivotTables, conditional formatting, and documentation
- ✅ Data Visualization: Interactive Power BI dashboards with geographic mapping
- ✅ Storytelling: Translating technical findings into actionable insights
- ✅ Problem-Solving: Overcoming real obstacles in messy, real-world data
This is just the beginning of our journey through 24 years of wildfire data. Follow along as we clean, analyze, and visualize patterns that could inform fire prevention strategies and resource allocation decisions.