Source: https://developer.chrome.com/blog/new-in-devtools-147/ Author: Matthias Rohmer Published: April 7, 2026
Chrome 147 introduces automatic context selection for AI assistance, upgrades code suggestions to full code completion, modernizes the Device Mode toolbar, brings automatic decoding of compressed network bodies, and several other enhancements.
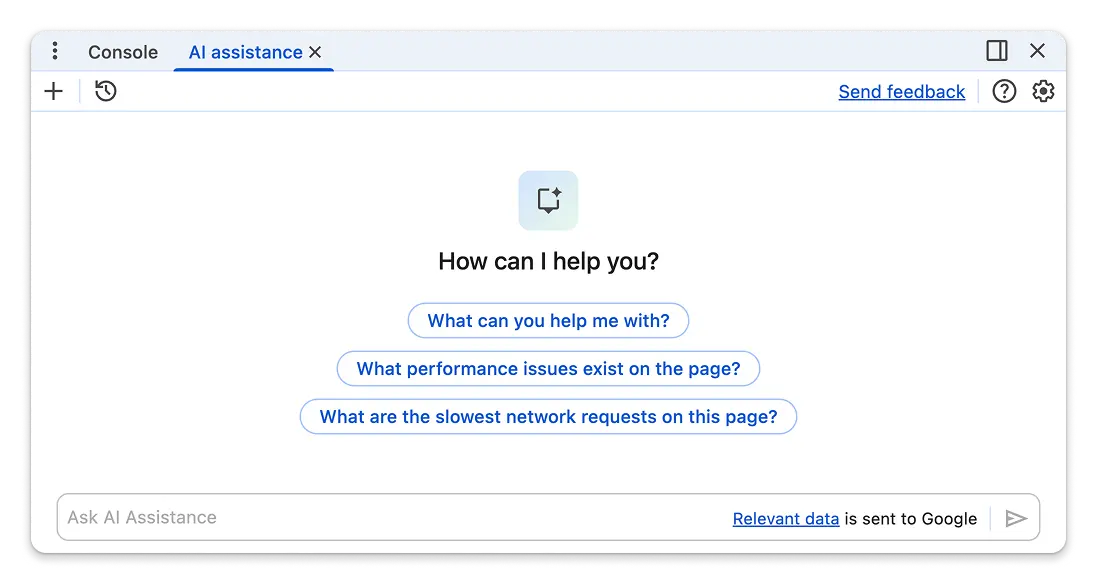
One of the top feature requests for AI assistance was the ability to ask more open-ended questions. A new context selection agent now lets you ask questions without prior context selected, for example:
- "What are the slowest network requests on this page?" — Previously not possible without selecting a specific network request.
- "What performance issues exist on the page?" — DevTools will now automatically record a trace with your selected settings to answer this.
- "How do I use the animation panel?" or "Where is the high contrast setting in DevTools?" — Provides direct help with DevTools itself.
As part of this change, AI assistance can now also automatically switch context. It will intelligently update the context based on your actions when the chat is empty, while respecting your manual selections once a conversation has started.
The Chrome DevTools MCP server and CLI have been updated to version 0.21.0, bringing significant improvements for multi-agent workflows, new auditing capabilities through Lighthouse, and an enhanced set of skills.
Key features added since the last update:
- Integrated Lighthouse audits — Run Lighthouse audits directly through MCP, enabling automated performance and quality checks within agentic workflows.
- Memory Leak Detection skill — New skill for detecting memory leaks using the
take_memory_snapshottool. - Accessibility skill improvements — Refined to better leverage Lighthouse and provide more robust output.
- General usage skills — Dedicated skills for using the Chrome DevTools MCP server or CLI, and troubleshooting installations.
- Multi-agent workflow support — Introduction of
pageIdrouting allows multiple agents to precisely target and interact with specific browser pages in parallel.
See the GitHub repository for detailed release notes.
In Chrome 142, code suggestions by Gemini were introduced in the Console and Sources panels. Chrome 147 upgrades this to full code generation.
To generate code:
- Type a natural language comment describing the logic you need — e.g.,
// Loop to check all img elements for valid alt attributes - Press
Cmd+i(Mac) orCtrl+i(Windows/Linux) to start generating.
Note: The
iin the shortcut is lowercase.
The Device Mode toolbar has been modernized for a more consistent and streamlined experience:
- Standardized Controls — Device selection, zoom levels, and Device Pixel Ratio (DPR) now use standard DevTools UI components.
- Streamlined Zoom — The zoom menu is cleaner; "Fit to window" is integrated directly into the percentage list. "Auto-adjust zoom" has moved to its own dedicated toolbar button.
- Orientation Lock Support — DevTools now handles the
screen.orientation.lock()API in device emulation. When a page locks the orientation, the emulated device rotates automatically to match, and the manual rotate button is disabled while the lock is active.
Chromium issue: 40807290
Diagnosing issues with compressed resources is now much easier. Previously, if an HTTP request used Content-Encoding: gzip or deflate, the Payload view in the Network panel showed garbled binary data.
In Chrome 147, DevTools automatically decodes compressed bodies, displaying readable content directly under Payload.
Additionally, the request listing now includes Transfer Size information, providing a clearer picture of data usage over the wire — a detail also used by AI Assistant to select requests better.
Chromium issue: 356158096
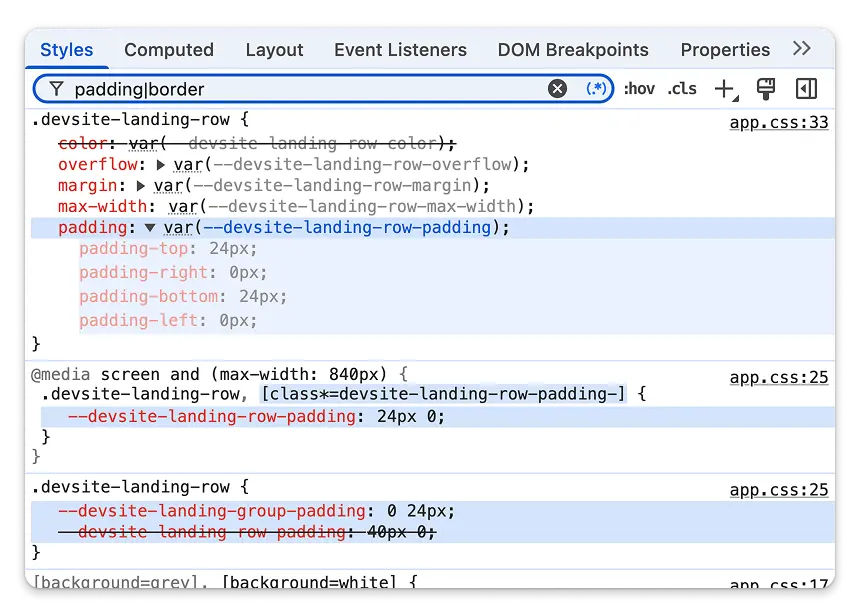
You can now use regular expressions in the filter bars for the Styles, Computed, and Properties panels. Click the new Regular expression toggle button (.*) to enable. For example, type padding|border to highlight all padding and border properties.
Chromium issue: 40706727
Debugging preloading is more robust with new features in the Application > Speculative loads panel:
- Text Filtering — Filter the list of rules and attempts using free text or keyed filters (e.g.,
url:,action:,status:), with AND logic between multiple terms. - Clear Button — Reset the preloading model and clear the displayed rules and attempts.
- HTTP Status Codes — For failed prefetches, DevTools now shows the actual HTTP status code (e.g., 404) instead of a generic failure message.
Chromium issues: 479524246, 40926909
- Console — When all inline stack frames of an error are ignore-listed but the call stack contains non-ignored frames, a toggle appears to help focus on actionable code while hiding noisy library traces. (379788109)
- Performance — The sidebar state (open/closed) is now persisted across recordings. (437340219)
- Settings — DevTools can now prompt you to restart the browser through an infobar when toggling certain experimental settings.
- Object Inspection — A new "Show all" context menu option in object views lets you toggle visibility of nullish (
nullorundefined) properties. (41187256) - Elements — The "ad" adorner is no longer restricted to iframes and can now be shown for arbitrary elements tagged as ad-related by the backend. (485493202)
- Instruction nodes — Processing Instruction nodes (e.g.,
<?xml-stylesheet ... ?>) are now visible and editable in the DOM tree. (484891675)
- Performance — The title help button in performance metric cards is now always visible and keyboard-accessible, rather than only appearing on hover. (487613506)
- Sources — Event listener breakpoints can now be checked or unchecked using the Space key. (478890182)
- Settings — The Home and End keys now work for navigating to the first and last items of the shortcut list. (481747256)
- Lighthouse — Improved screen reader announcements for category group checkboxes. (477643909)
Content licensed under Creative Commons Attribution 4.0. Last updated 2026-04-07 UTC.