TEDS-A Sample Data Exploration
This repository contains a sample of the Treatment Episode Admissions AND Discharge Data Sets (TEDS-A and TEDS-D) used for exploratory data analysis, used for demonstration and research purposes only.
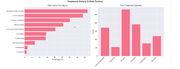
The dataset includes individuals from multiple regions, with the distribution across states showing noticeable variation.
Region Distribution:
- West: 307 individuals (30.7%)
- Northeast: 261 (26.1%)
- South: 243 (24.3%)
- Midwest: 188 (18.8%)
Education Level:
- Grade 12/GED: 43.2%
- Grades 9-11: 14.1%
- 1-3 years college: 13.0%
- Less than Grade 9: 4.5%
- 4+ years college: 4.1%
Conclusion: The dataset shows regional variation with the West most represented, and moderate educational attainment levels centered around high school completion.
Age Distribution:
- Most common: 30-34 years (173 individuals)
- 35-39 years: 151 individuals
- 25-29 years: 143 individuals
Concentration in adults aged 25-44 years.
Gender Distribution:
- Male: 64.3%
- Female: 35.6%
Race Distribution:
- White: 59.2%
- Black/African American: 19.9%
- Other single race: 6.2%
- American Indian: 3.7%
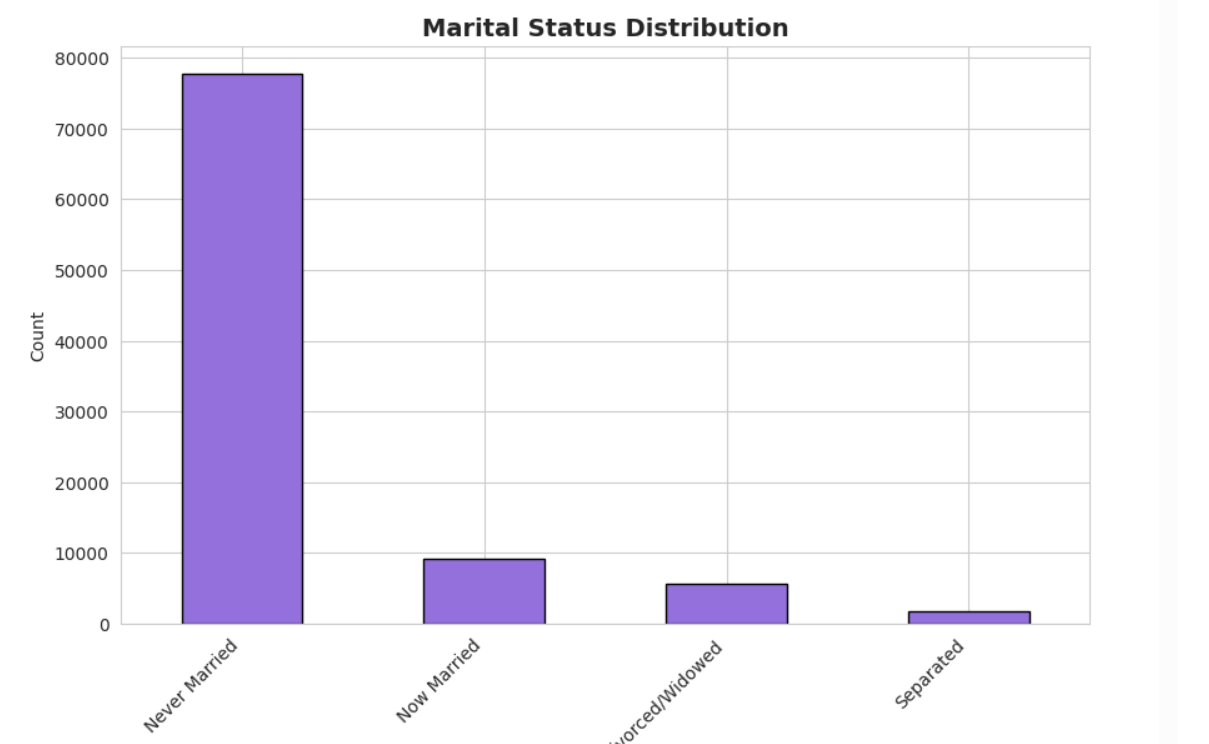
Marital Status:
- Never married: 49.2%
- Divorced/widowed: 10.3%
- Now married: 9.7%
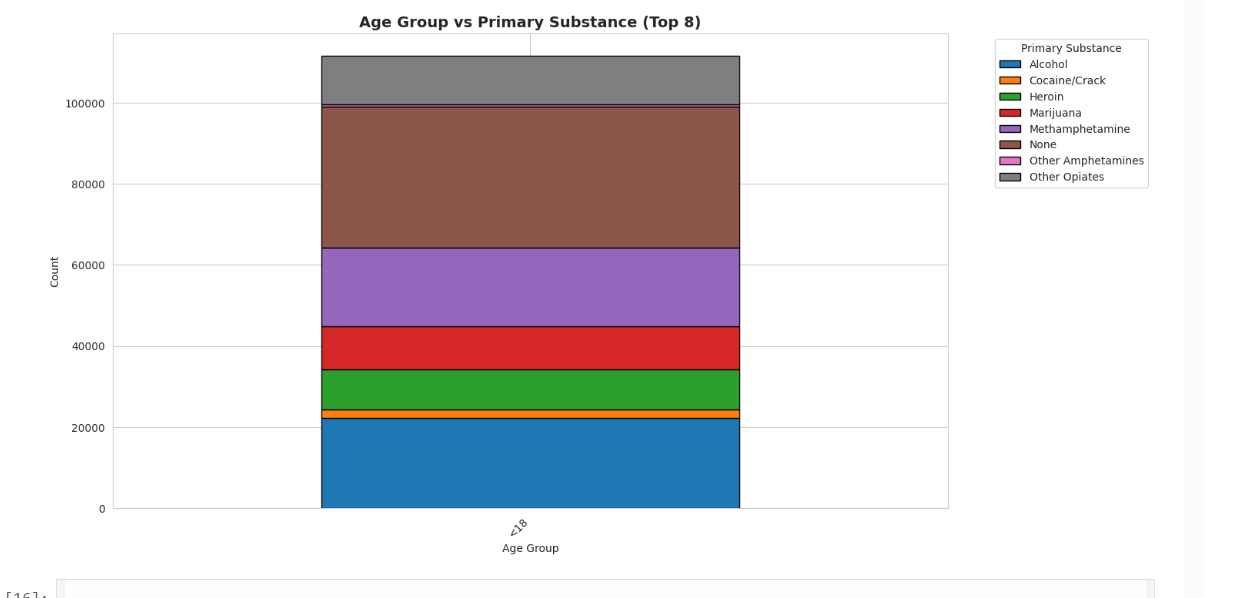
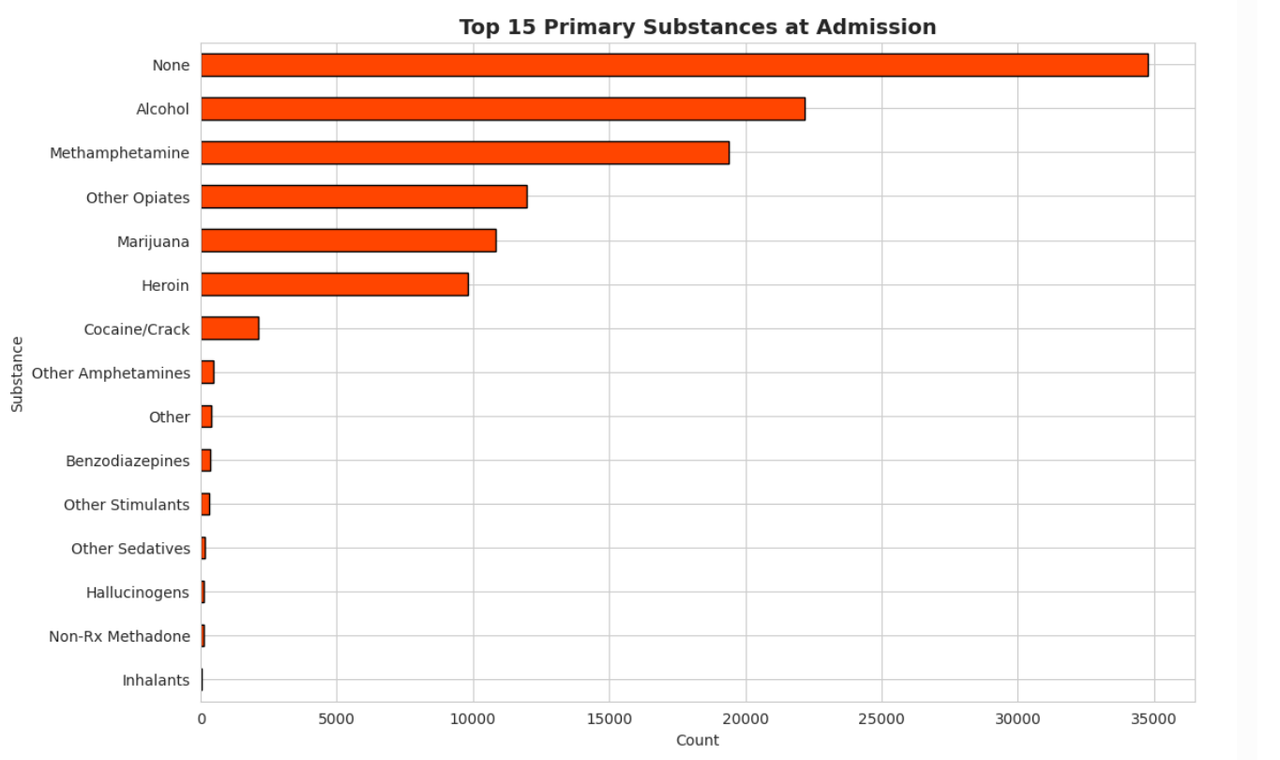
Primary Substance:
- Alcohol: 319 (31.9%)
- Other opiates/synthetics: 119 (11.9%)
- Heroin: 102 (10.2%)
- Methamphetamine/speed: 98 (9.8%)
- Marijuana/hashish: 82 (8.2%)
- Cocaine/crack: 51 (5.1%)
Substance Categories:
- Alcohol: 31.9%
- Opioids: 22.1%
- Stimulants: 15.5%
- Cannabis: 8.2%
Years of Use:
- Mean: 19.01 years
- Median: 16 years
- Range: 0-57 years
Conclusion: Alcohol is the most common primary substance, followed by
opioids and stimulants. Long duration of use (median 16 years) indicates
chronic patterns.
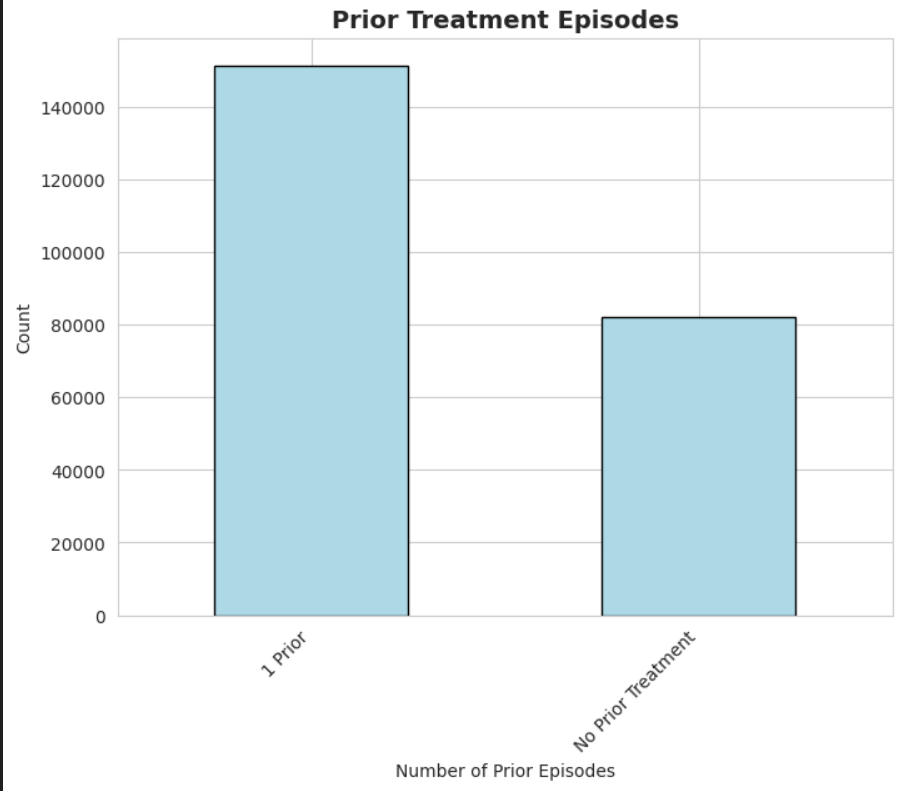
Prior Treatment Episodes:
- No prior treatment: 28.1%
- One prior: 19.1%
- Two prior: 12.0%
- Three prior: 7.6%
- Five or more prior: 17.1%
Conclusion: Nearly 72% have prior treatment history, indicating chronic
or recurring treatment patterns.
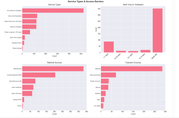
Service Type:
- Non-intensive Outpatient: 52.2%
- Detox 24hr Residential: 12.7%
- Rehab Short-term (≤30 days): 12.1%
- Intensive Outpatient: 12.0%
- Rehab Long-term (>30 days): 6.7%
Wait Time:
- Same day: 72.7%
- 1-7 days: 18.0%
- 8-14 days: 4.1%
- 15-30 days: 2.7%
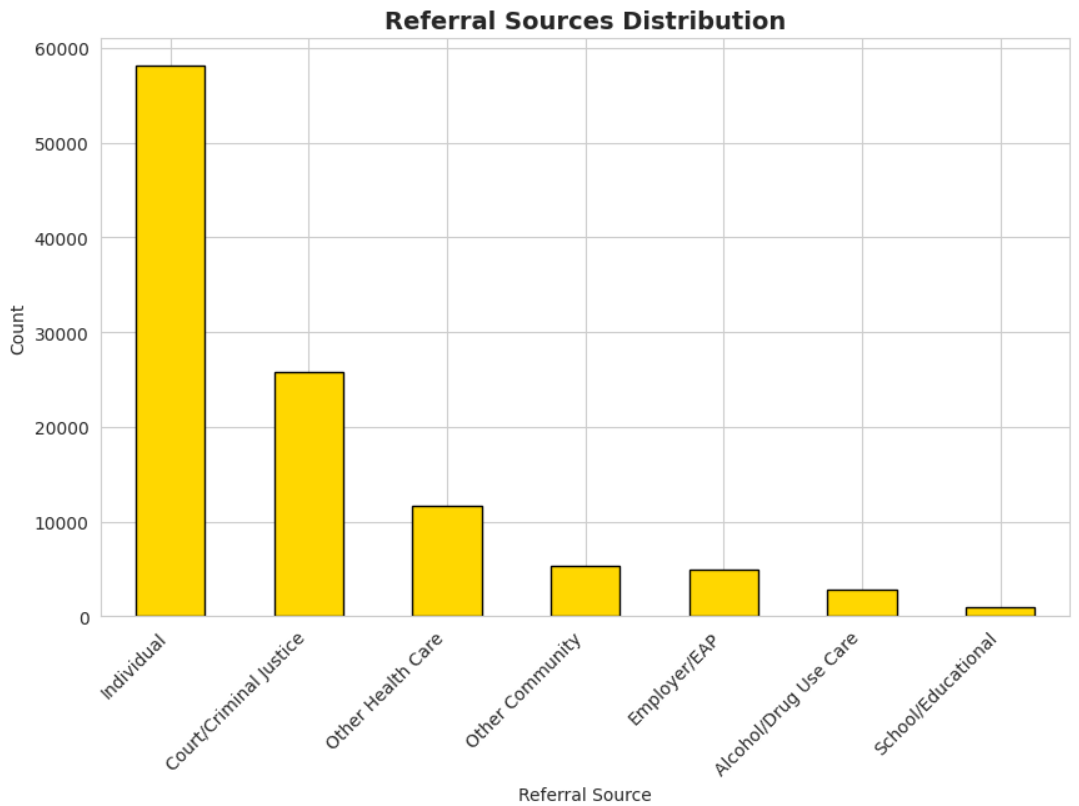
Referral Sources:
- Self/Individual: 38.1%
- Criminal justice/DUI/DWI: 20.5%
- Alcohol/drug provider: 8.2%
- Other healthcare: 6.9%
Primary Payment:
- Medicaid: 60.4%
- Other government: 14.8%
- Private insurance: 7.6%
- Self-pay: 7.2%
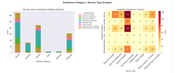
Alcohol users:
- Non-intensive Outpatient: 38.6%
- Detox 24hr Residential: 20.1%
- Intensive Outpatient: 14.1%
Opioid users:
- Non-intensive Outpatient: 53.8%
- Detox 24hr Residential: 15.4%
Cannabis users:
- Non-intensive Outpatient: 72.0%
Conclusion: Service type varies by substance, with Cannabis users primarily
in outpatient settings and Alcohol users utilizing more detox services.
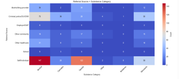
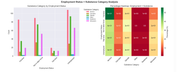
Strongest Correlations:
- Opioid primary <-> Injection use: 0.33
- Polysubstance <-> Injection use: 0.26
- Polysubstance <-> No income: 0.19
- Polysubstance <-> Homelessness: 0.15
- Homeless <-> No income: 0.14
Conclusion: Injection drug use, polysubstance patterns, and socioeconomic
vulnerabilities are interconnected risk factors.
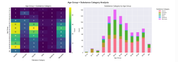
- Unemployed: large representation in Alcohol, Opioids, and Stimulants users
- Not in labor force: significant numbers across all major substance categories
- Full-time employed: present across all substance types
Among those with five or more prior episodes:
- 88 without mental health disorder
- 83 with mental health disorder
Conclusion: Co-occurring mental health is common among individuals with chronic treatment patterns.
Key Takeaways
- Service concentration: Most admissions (52.2%) are to non-intensive outpatient programs with same-day access.
- Substance profile: Alcohol dominates (31.9%), followed by opioids (22.1%) and stimulants (15.5%).
- Chronic patterns: 72% have prior treatment history, with 17.1% having five or more episodes.
- Vulnerable populations: Polysubstance users face higher rates of homelessness and income insecurity.
- Co-occurring conditions: Mental health disorders common among those with multiple prior episodes.
- Access pathways: Self-referral (38.1%) and criminal justice (20.5%) are primary entry points
The dataset shows distinct patterns in the population entering and leaving treatment.
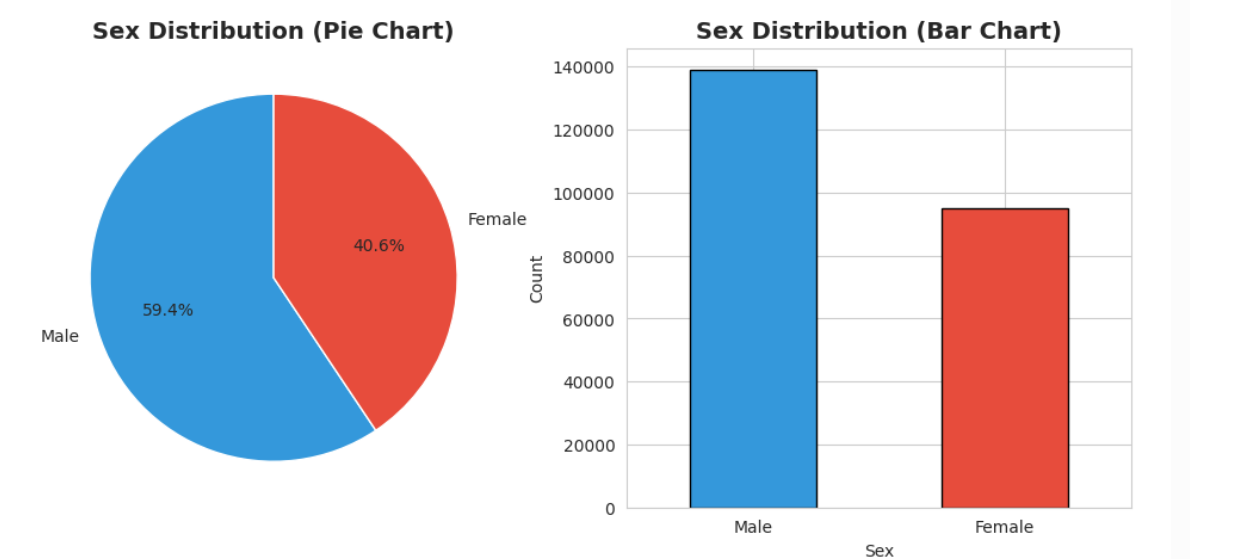
Sex Distribution:
-
Male: 64.7%
-
Female: 35.3%
Conclusion: The treatment population remains predominantly male, accounting for nearly two-thirds of all discharges.
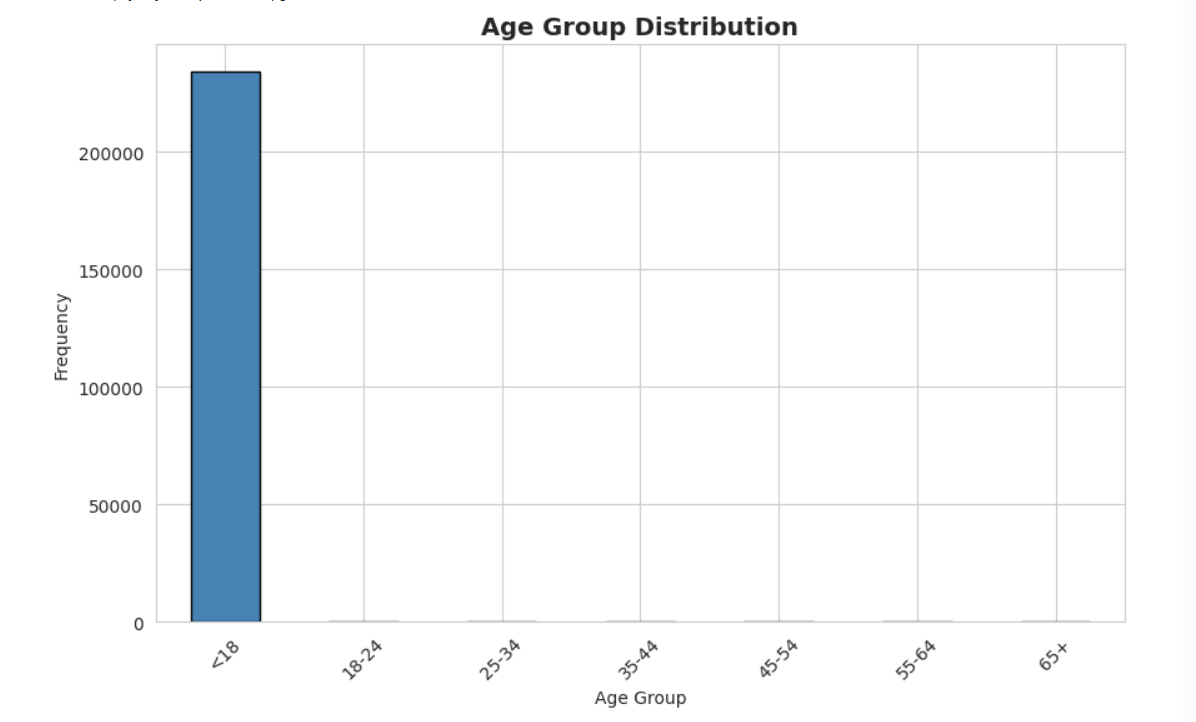
Age Distribution:
- Second Most Common: Adults aged 35–44 (28.3%)
Conclusion: Treatment is heavily concentrated among young to middle-aged adults (ages 25–44), representing over 65% of the total population.
Race/Ethnicity Distribution:
Conclusion: White individuals constitute the majority of discharges, followed by Black and Hispanic populations.
Marital Status:
- Never Married: ~52% (Dominant category)
Conclusion: Single individuals (Never Married) represent more than half of the treatment population, indicating lower social support structures compared to married individuals.
Primary Substance:
-
Alcohol: 35.5% (Rank: #1)
-
Heroin: 16.9%
-
Marijuana/Hashish: ~12-14%
-
Methamphetamine: ~10-11%
-
Other Opiates/Synthetics: ~8-9%
-
Cocaine/Crack: ~5-6%
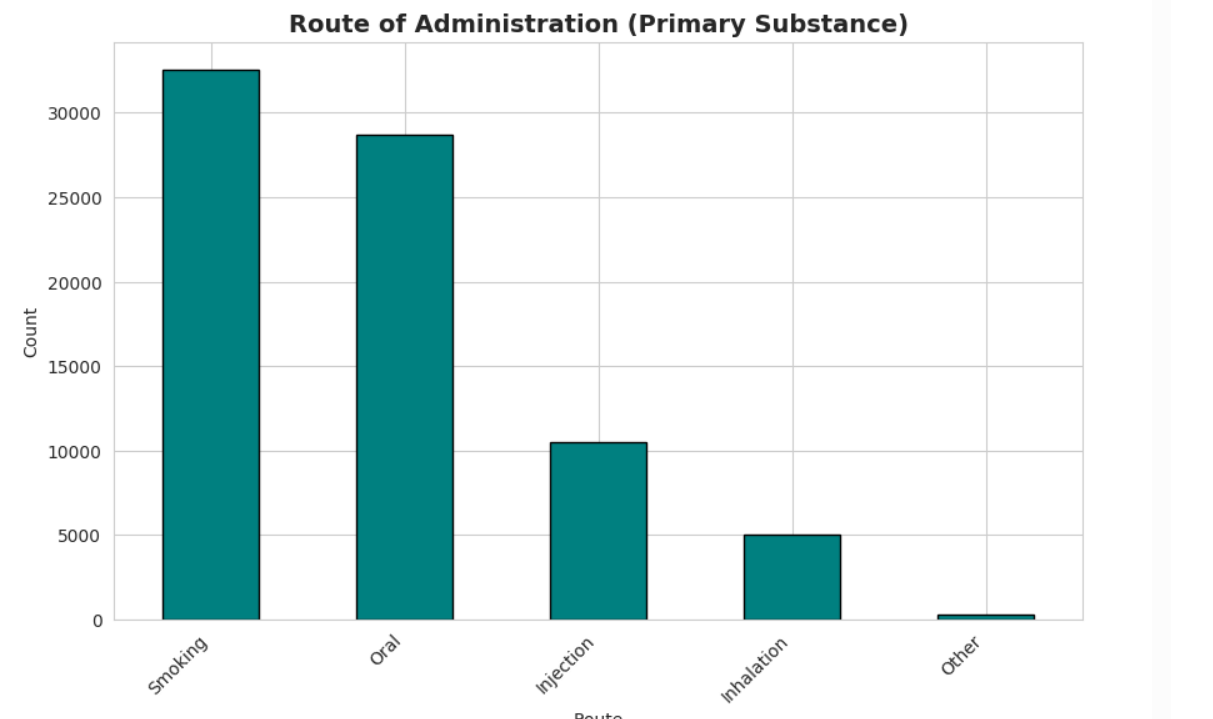
Route of Administration:
-
Smoking: Primary route for Cocaine/Crack and Marijuana.
-
Oral: Dominant route for Alcohol and Other Opiates.
Conclusion: Alcohol remains the single most common substance (35.5%), but Opioids (Heroin + Other Opiates) combined account for nearly 26% of all discharges, representing a significant burden on the system.
- Over 60% of patients have at least one prior treatment episode, reinforcing the chronic, relapsing nature of the condition.
Prior Treatment Episodes:
- 5+ Prior Episodes: ~15.0%
Referral Sources:
-
Individual/Self: ~35-40% (Primary voluntary source)
-
Criminal Justice/DUI: ~30-35% (Primary mandatory source)
Community/Social Services: ~10-15%
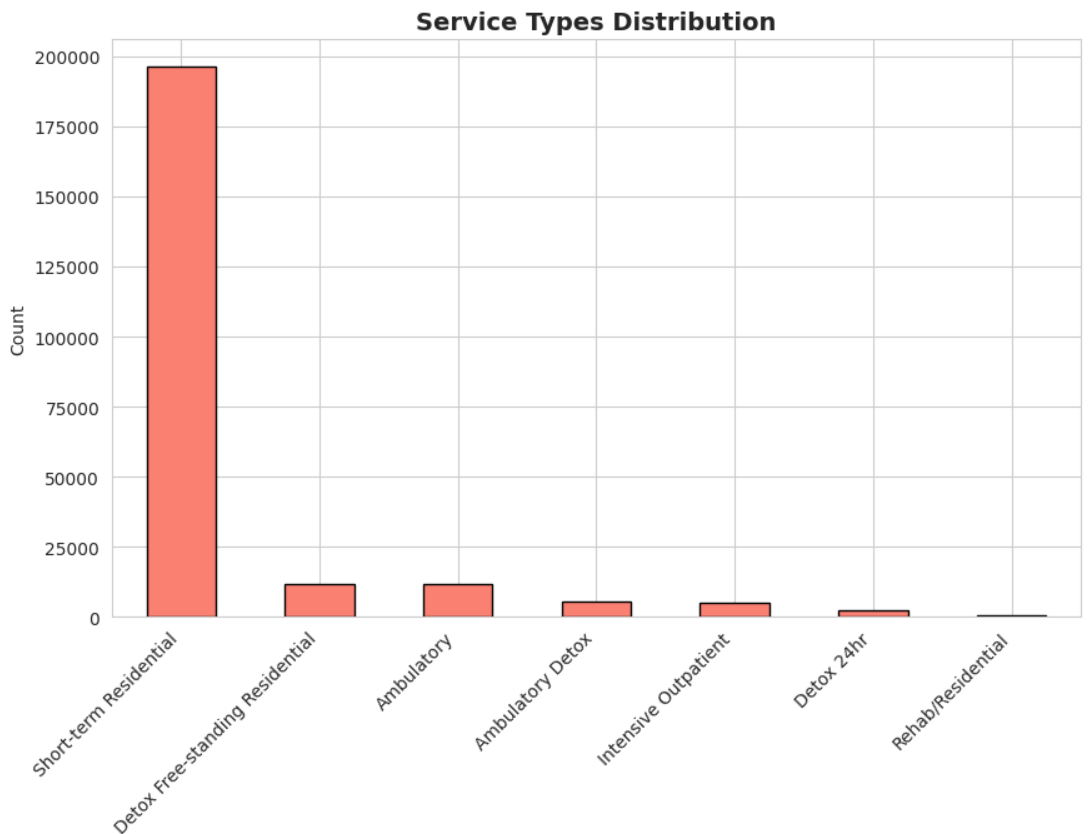
Most of the treatments are short-term resedantial 80%
Service Type Distribution:
- Detox (24hr Residential): ~10%
- Rehab/Residential: ~15%
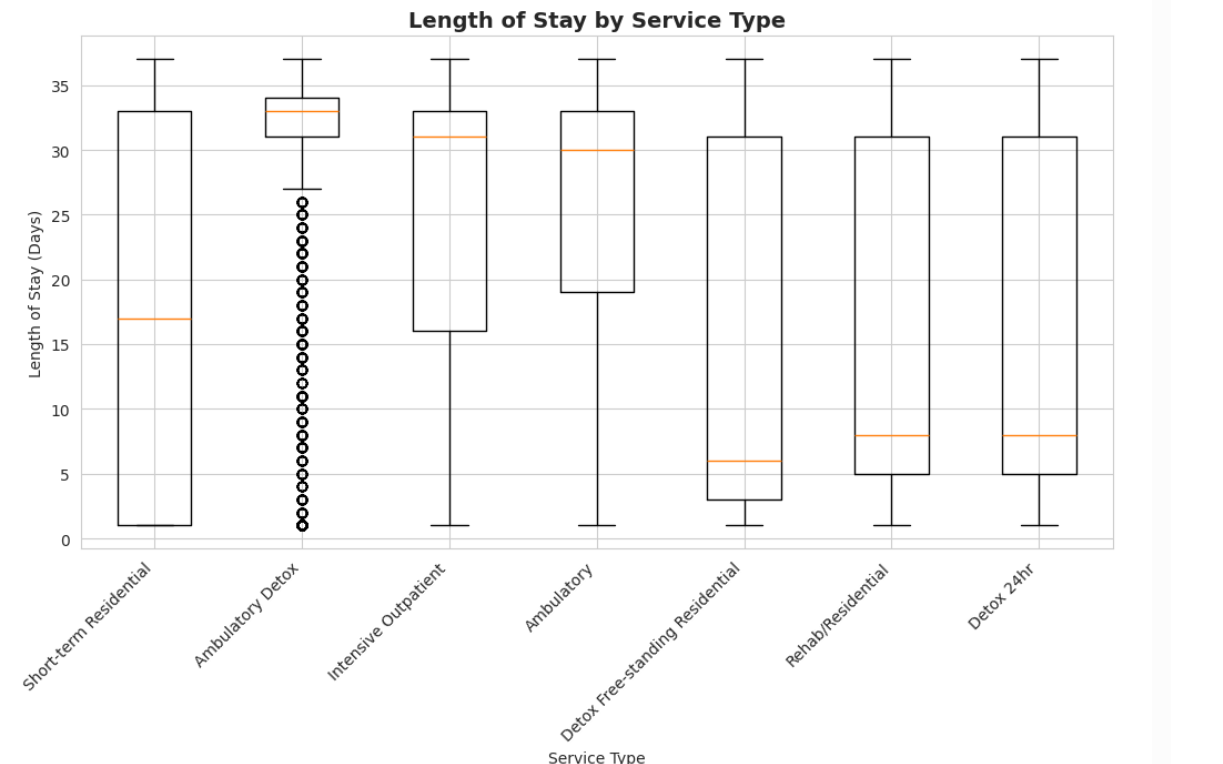
Length of Stay:
-
Detox: Median stay 3–5 days (Short-term).
-
Residential: Median stay 30–90 days.
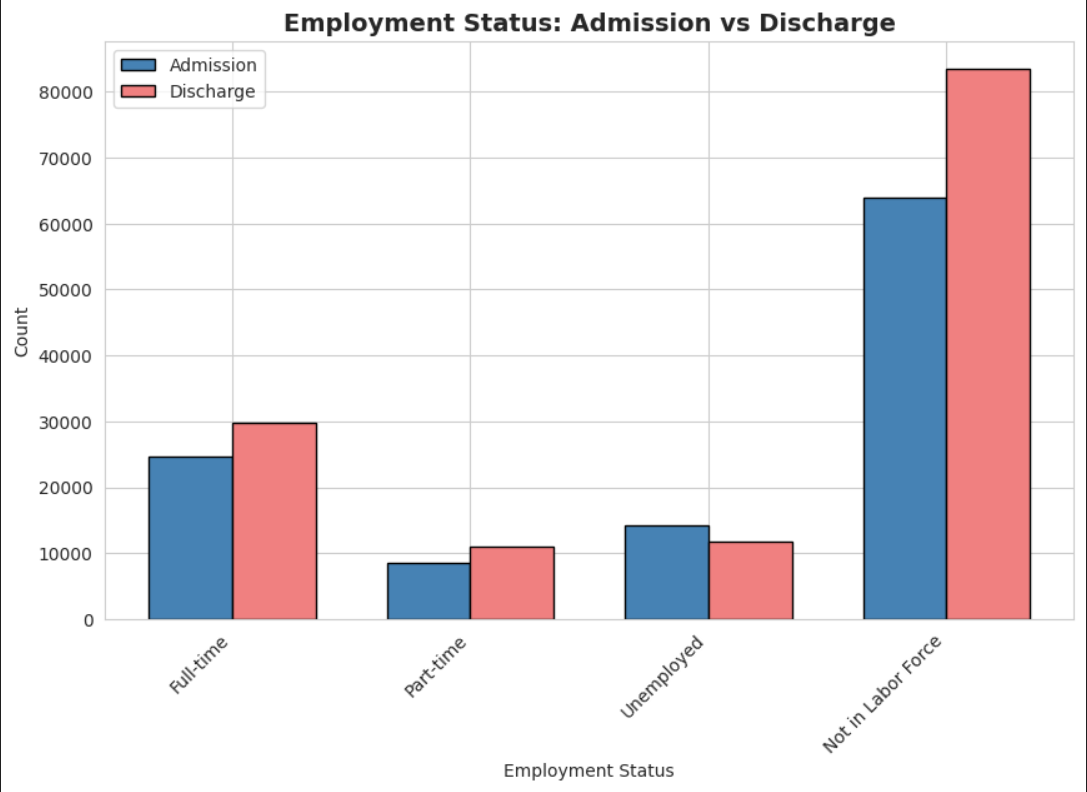
The analysis compares economic stability between the start and end of treatment.
Employed (Full/Part-time): ~22%
Conclusion: Employment rates show minimal improvement between admission and discharge, suggesting that treatment engagement alone does not immediately resolve economic barriers.
-
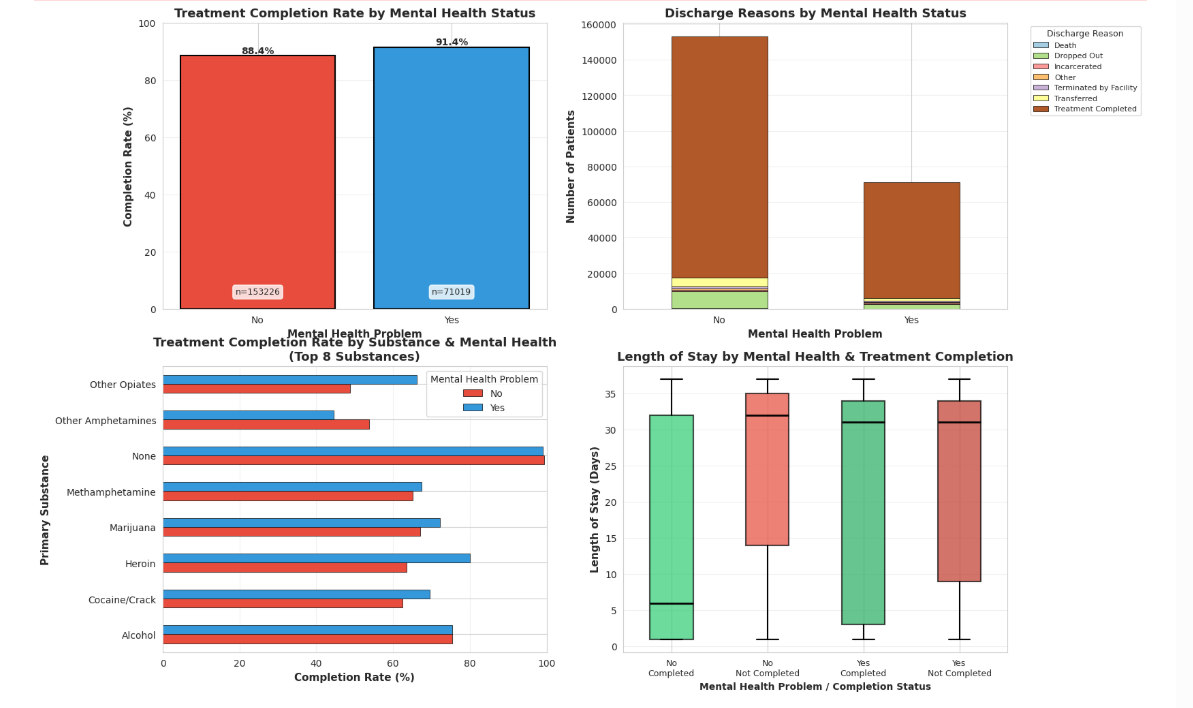
Co-occurring Disorders: Approximately 45-50% of patients have a diagnosed mental health problem.
-
Impact on Outcome: Patients with co-occurring mental health disorders have a slightly lower completion rate and higher transfer rate than those without, often requiring more intensive or longer-term care. episodes.
-
Vulnerable Populations: Young adults (25-34), unemployed Completion Rate: Less than half (47.4%) of all discharges result in completed treatment, highlighting a retention gap.
-
Substance Dominance: Alcohol drives over 1/3 of all admissions, but Opioids represent the most severe chronic cases (high prior episodes).
-
Completion Rate: Less than half (47.4%) of all discharges result in completed treatment, highlighting a retention gap.