-
Notifications
You must be signed in to change notification settings - Fork 0
Expand file tree
/
Copy path07-reporting.Rmd
More file actions
55 lines (34 loc) · 3.38 KB
/
Copy path07-reporting.Rmd
File metadata and controls
55 lines (34 loc) · 3.38 KB
1
2
3
4
5
6
7
8
9
10
11
12
13
14
15
16
17
18
19
20
21
22
23
24
25
26
27
28
29
30
31
32
33
34
35
36
37
38
39
40
41
42
43
44
45
46
47
48
49
50
51
52
53
54
55
# Reporting results
Once we have performed an enrichment analysis, how should we communicate the results? As with everything, it depends on what you need to convey. Some examples are below.
## In text
If you just need to emphasise that the differential expression relates to a condition of interest, you don't need much:
> Genes differentially expressed after SH-SY5Y cell differentiation were enriched for the GO term “regulation of neurogenesis” (adjusted p-value < 0.01).
In the methods section:
> Enrichment was calculated for differentially expressed genes using the g:GOSt enrichment tool [(Raudvere et al, 2019)](https://academic.oup.com/nar/article/47/W1/W191/5486750) using a background of tested genes.
## As a table
For a more complete view, a table of the significant or top _n_ terms can be useful. e.g., in a supplementary figure.
The top 10 enriched GO terms for the differentially expressed genes are shown below:
| GO:BP Term | Term ID | Adjusted p-value | Term Size | Num DE Genes |
|------------------------------------------|------------|-----------------:|----------:|------------------:|
| system process | GO:0003008 | 2.90E-04 | 1243 | 45 |
| nervous system development | GO:0007399 | 4.19E-04 | 1985 | 60 |
| regulation of cell development | GO:0060284 | 1.98E-03 | 795 | 33 |
| central nervous system development | GO:0007417 | 2.67E-03 | 805 | 33 |
| regulation of neurogenesis | GO:0050767 | 5.59E-03 | 707 | 30 |
| regulation of nervous system development | GO:0051960 | 5.78E-03 | 790 | 32 |
| regulation of cell differentiation | GO:0045595 | 6.03E-03 | 1471 | 47 |
| multicellular organismal process | GO:0032501 | 2.04E-02 | 5300 | 111 |
| system development | GO:0048731 | 2.88E-02 | 3668 | 85 |
| neurogenesis | GO:0022008 | 4.36E-02 | 1375 | 43 |
## As a figure
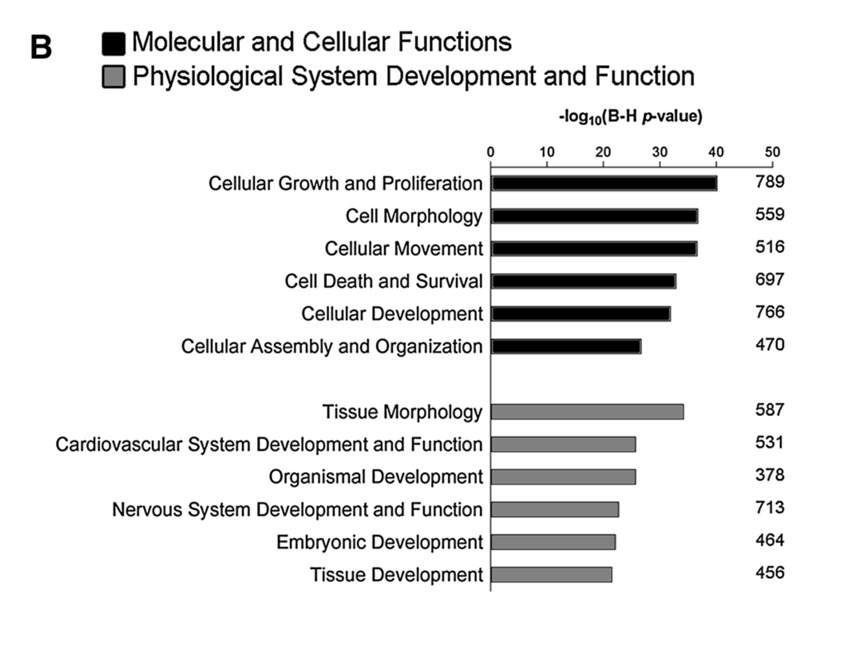
Plots of –log(p-value) are a popular option for figures. By taking the negative logarithm of the p-value, larger bars indicate greater significance.
For instance, the following figure is taken from the [(Pezzini et al. 2017)](https://link.springer.com/article/10.1007%2Fs10571-016-0403-y) paper.
Note that this figure shows two specific categories from the IPA (Ingenuity Pathway Analysis) database using the IPA tool (not covered here), so the terms differ.
<!--  -->
```{r, out.width="90%", fig.align='center'}
# knitr::include_graphics("https://monashbioinformaticsplatform.github.io/enrichment_analysis_workshop/img/NegLogPvalPlot_Pezzini2017.png")
knitr::include_graphics("images/NegLogPvalPlot_Pezzini2017.png")
```
You can also enhance such plots by including the number of genes and other attributes. For an example, see the "bubble" chart produced by the R package `pathfindR`: https://www.biostars.org/p/322415/
----
There are also tools like ClueGO (a Cytoscape plugin) that build enriched terms into a network : http://apps.cytoscape.org/apps/cluego