Releases: PowerShell/vscode-powershell
Release list
v1.3.0

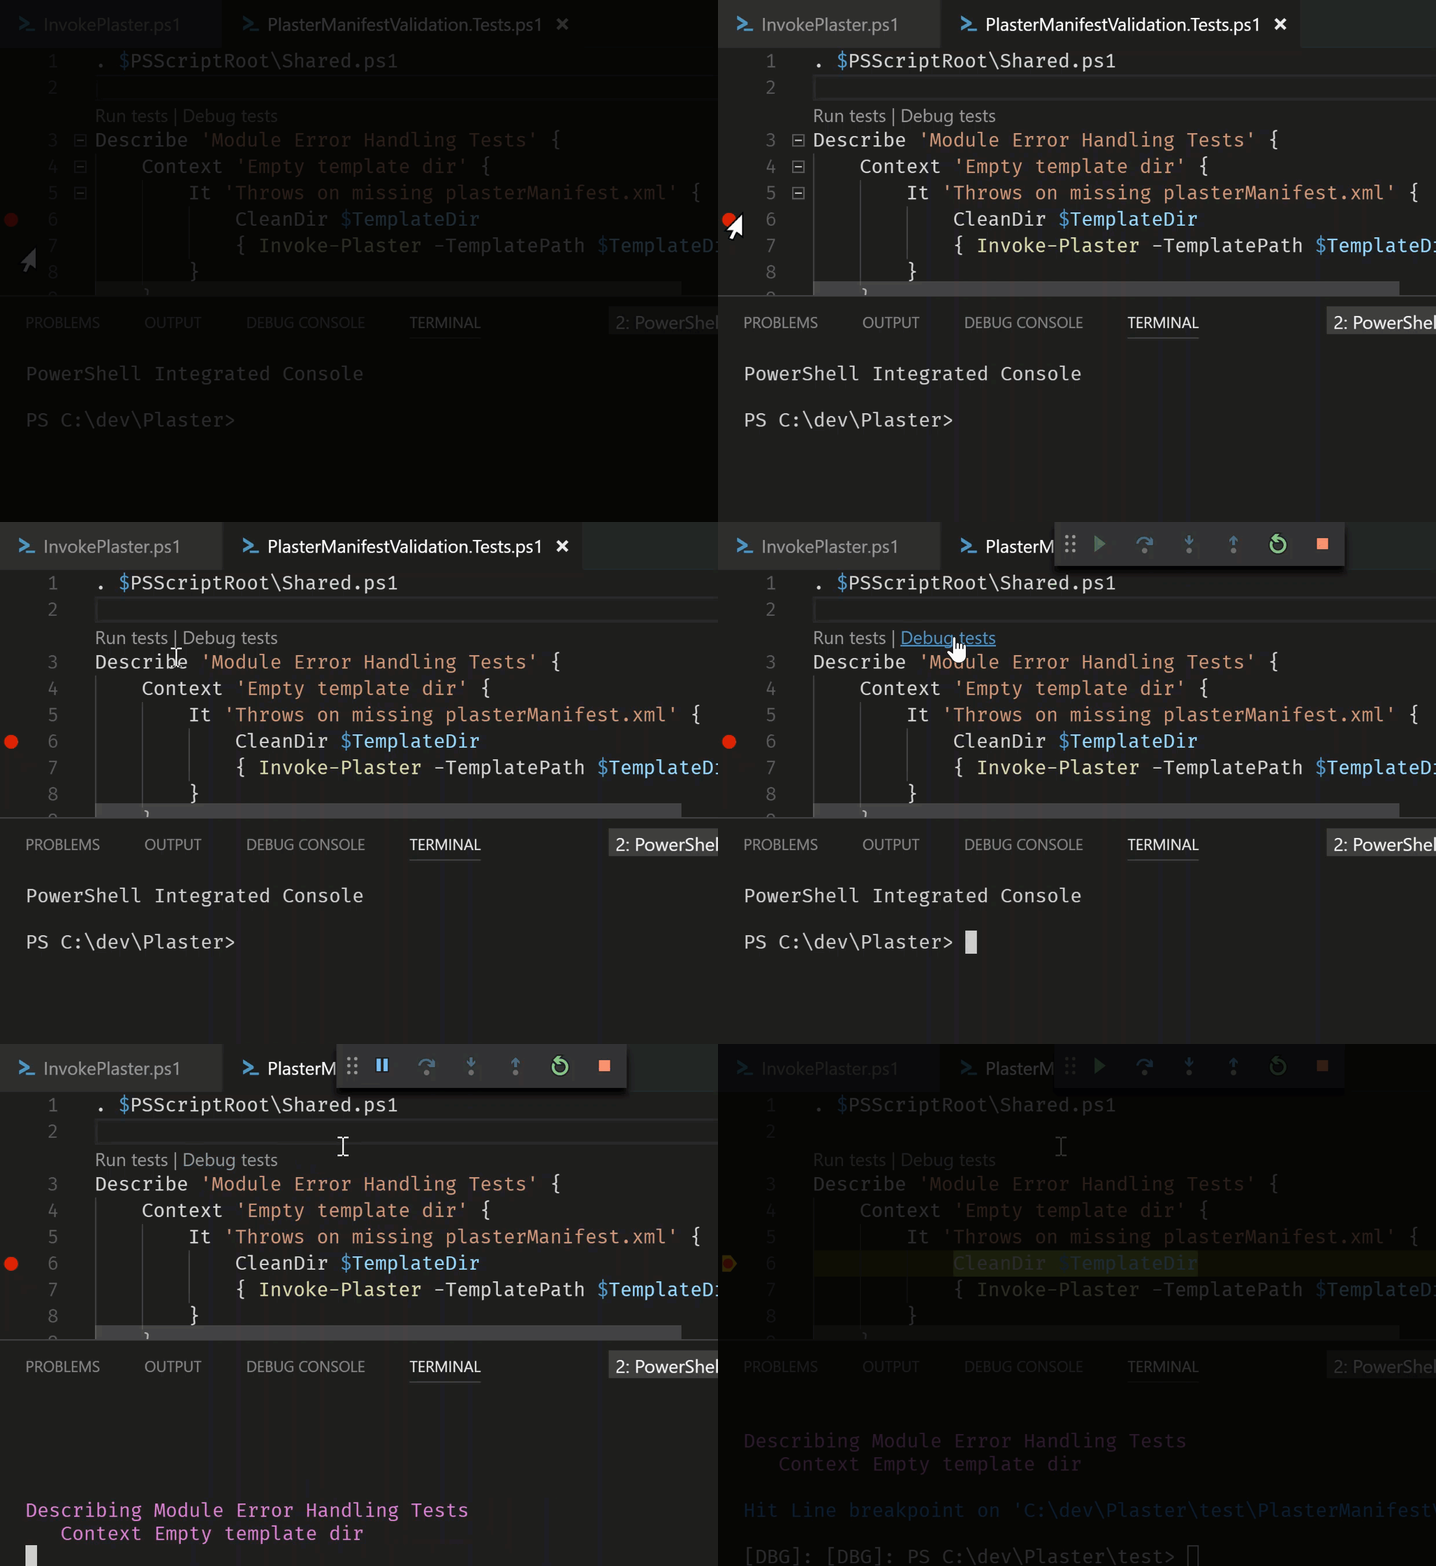
CodeLens for running and debugging Pester tests
We've added two new CodeLens actions that show up above Describe blocks in your Pester tests, "Run tests" and "Debug tests". By clicking one of these CodeLenses, your tests will be executed in the Integrated Console with the debugger attached. You can now set breakpoints and quickly debug a portion of your test script:
CodeLens support for finding references of a function or cmdlet
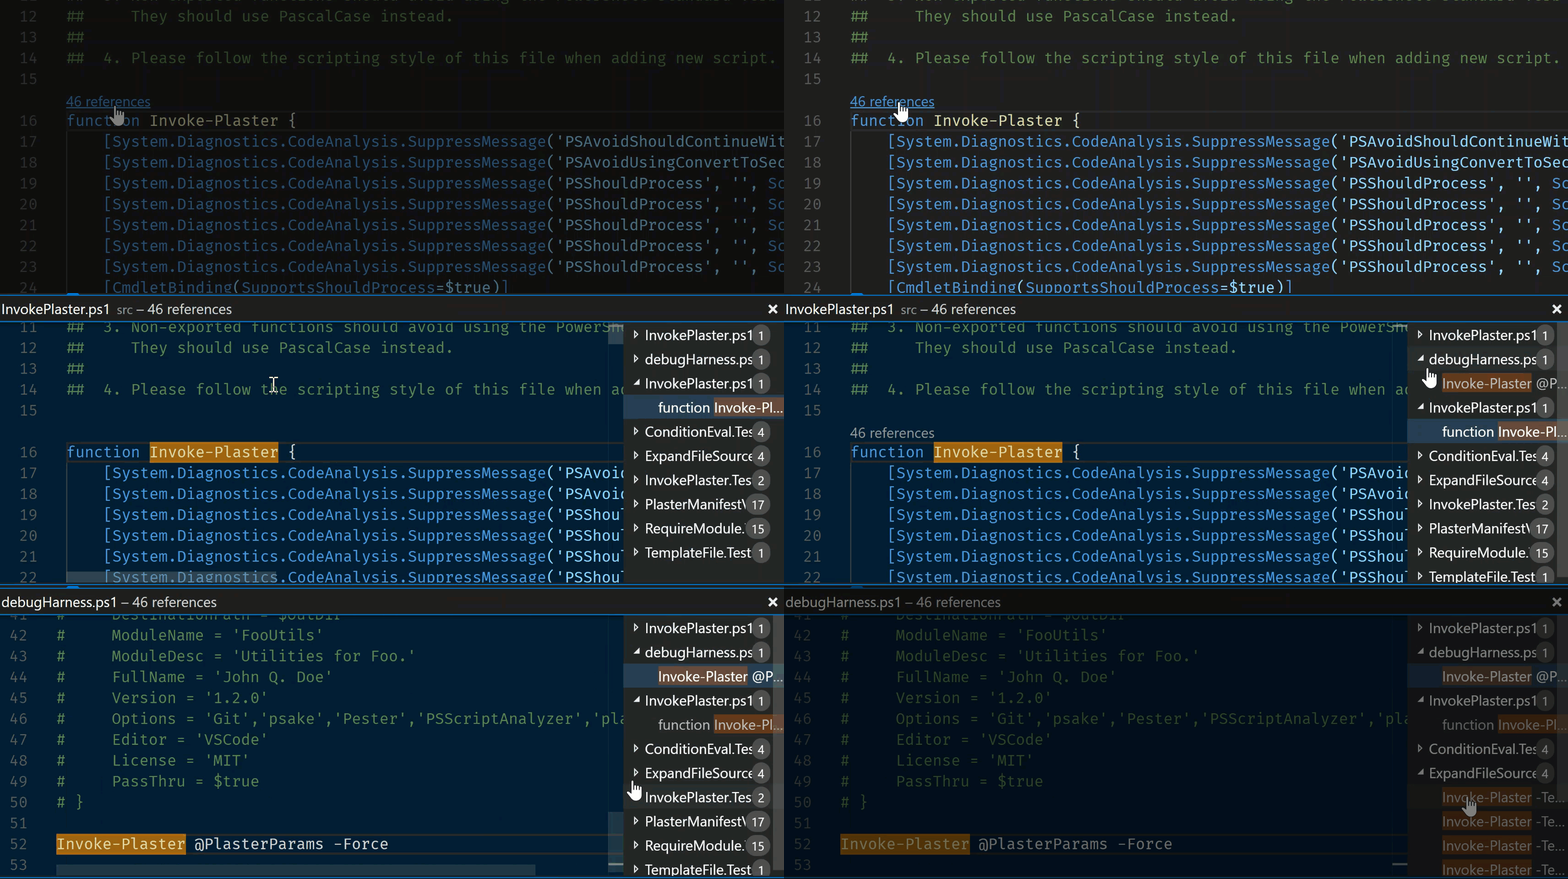
We've also added CodeLenses for showing the number of references for a function or cmdlet that is defined in a script. If you click this CodeLens, the references pane will appear so that you can navigate through all of the references:
We will add CodeLens support for PowerShell 5+ classes and class methods in a future update!
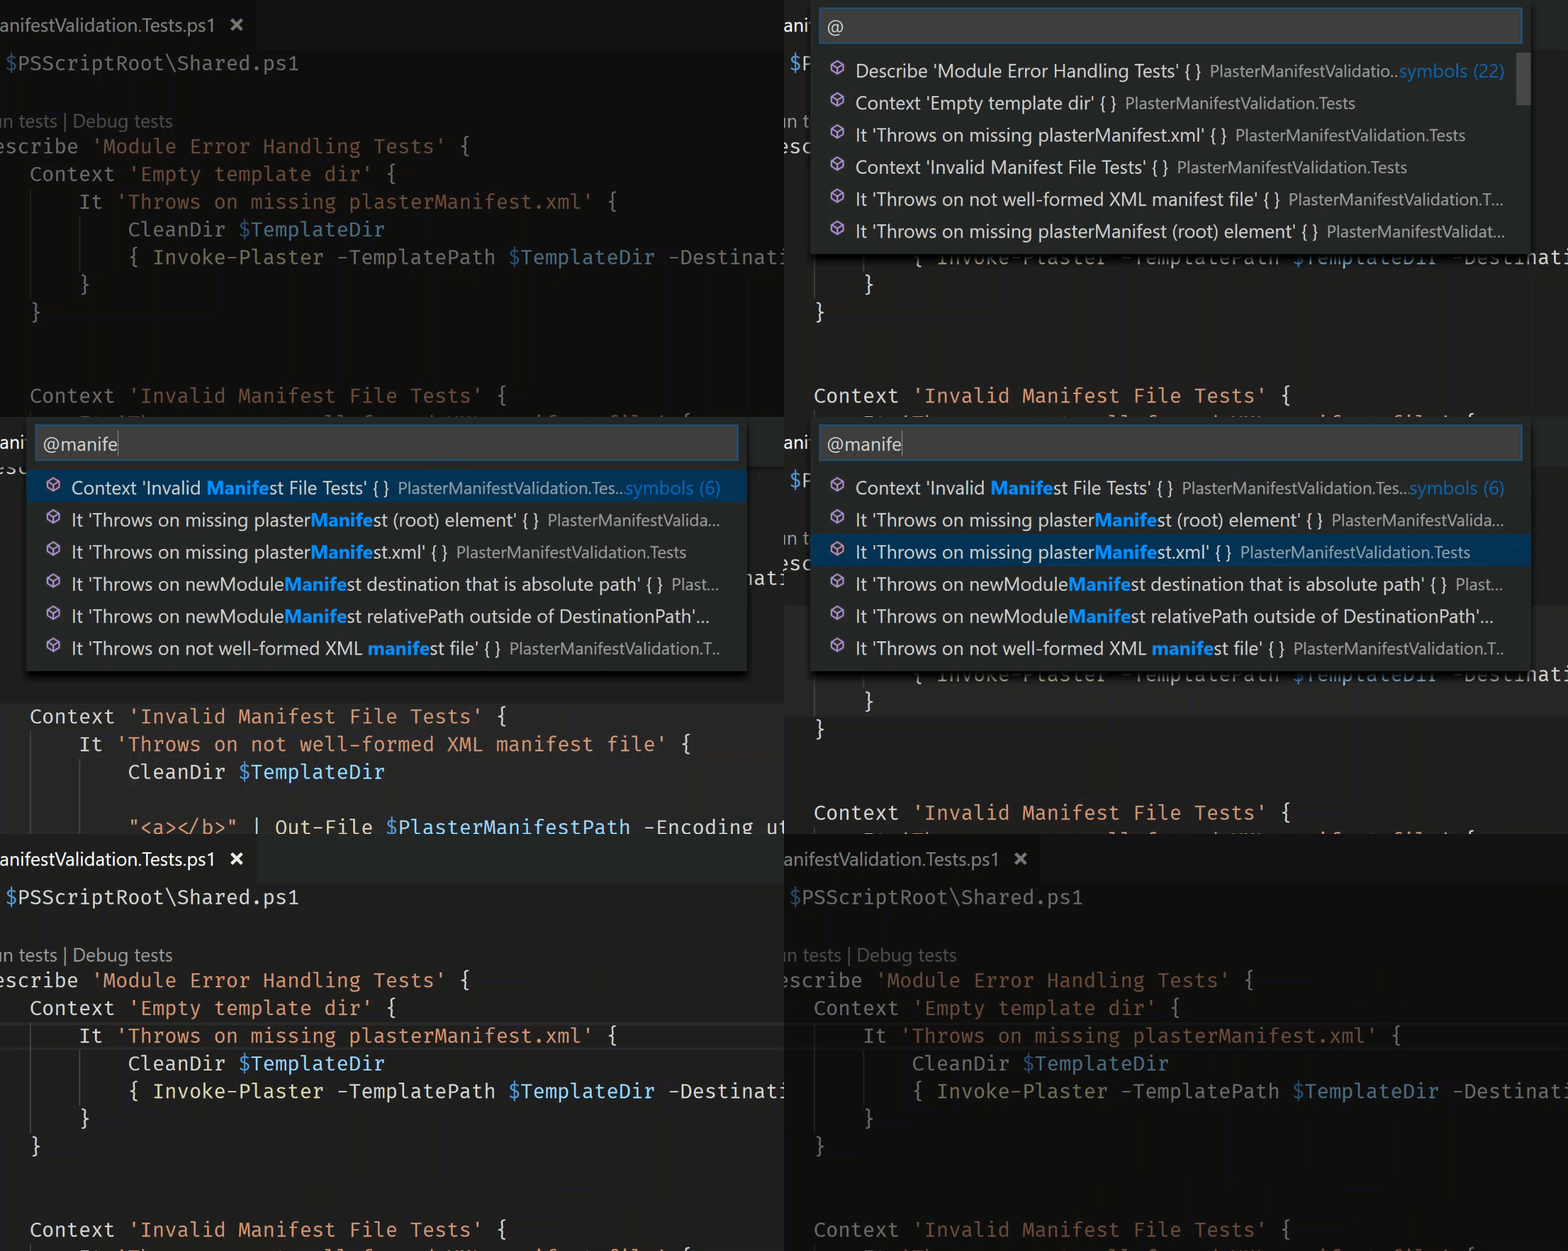
Document symbol support for Pester tests
We've also added document symbol support for Pester tests so that you can easily navigate among the Describe, Context, and It blocks in large Pester script files:
New PowerShell ISE theme
We now include a new color theme that tries to provide a faithful interpretation of the PowerShell ISE's style, including a blue console background! To use this theme open the Command Palette (Ctrl+Shift+P), run the "Preferences: Color Theme" command, then select "PowerShell ISE".
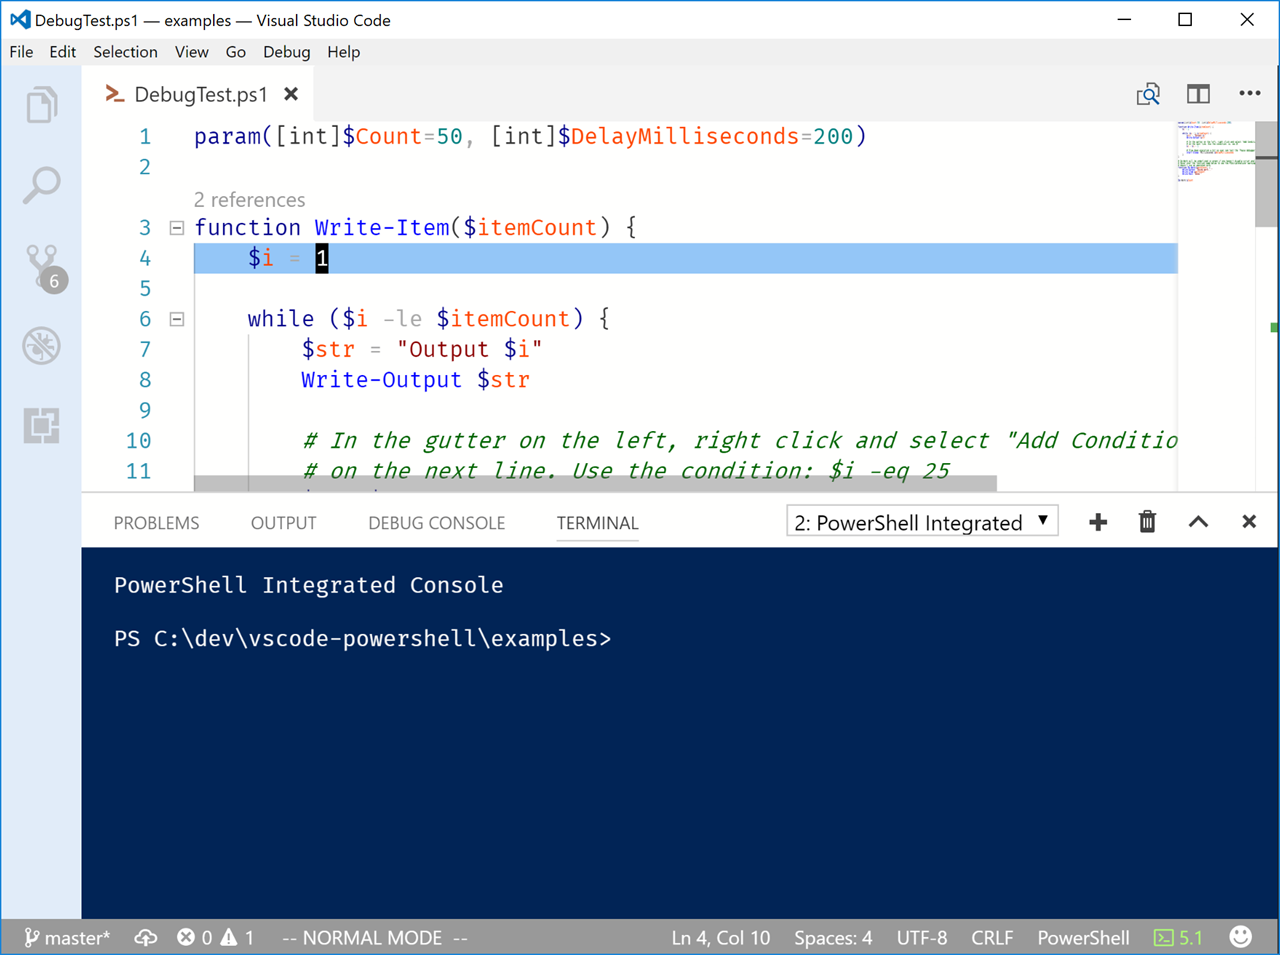
This is a first attempt at making this happen so give us feedback if you think that the colors can be improved! Super huge thanks to Matt McNabb for putting this together!
New cmdlets inside the Integrated Console
Thanks to new PowerShell Editor Services co-maintainer Patrick Meinecke, we've gained a new set of useful commands for interacting with the $psEditor APIs within the Integrated Console:
- Find-Ast
- Get-Token
- ConvertFrom-ScriptExtent
- ConvertTo-ScriptExtent
- Set-ScriptExtent
- Join-ScriptExtent
- Test-ScriptExtent
- Import-EditorCommand
This should also resolve the issues some people were seeing when we tried to load the unsigned temporary script containing Register-EditorCommand on machines with an AllSigned execution policy (#784).
Fixes and improvements
- #827 - Fixed an issue where an Output panel will appear with an error when you close the PowerShell Integrated Terminal
v1.2.1
Fixes and improvements
-
PowerShell/PowerShellEditorServices#478 - Dynamic comment help snippets now generate parameter fields correctly when
<#is typed above aparam()block. -
#808 - An extra
PS>is no longer being written to the Integrated Console for some users who have custom prompt functions. -
#813 - Finding references of symbols across the workspace now properly handles inaccessible folders and file paths
-
#810 -
$psEditor.GetEditorContext()now doesn't throw exceptions when in an untitled file -
#807 - The users's previously selected PowerShell session type is now retained when running the "PowerShell: Restart Current Session" command.
-
#821 - Note properties on PSObjects are now visible in the debugger's Variables view
v1.2.0
Dynamic comment-based help snippets now work inside functions (#763)
You asked for it, you got it! Dynamic comment-based help snippets now work inside function definitions, both above the param() block and at the end of the function body:

NOTE: There is an issue where parameter sections don't get generated inside of a function with a [CmdletBinding()] attribute. This is being tracked at PowerShell/PSScriptAnalyzer#768.
Session menu now contains entries for PowerShell Core installations on Windows (#794)
It's now much easier to switch between Windows PowerShell and PowerShell Core installs on Windows. When you run the "PowerShell: Show Session Menu" command or click the PowerShell version indication in the status bar you'll now see PowerShell Core entries in the menu:

Improved PSScriptAnalyzer marker display and suppression snippets (#781) and (#783)
The green squiggle markers you receive from PSScriptAnalyzer now include the name of the corresponding rule in their description:

This is really helpful with the new rule suppression snippets contributed by Jos Verlinde! You can access them by typing suppress- and selecting one of the suppression snippet options:

New built-in Pester problem matcher (#798)
We now include a built-in problem matcher for Pester test output so that you don't need to define one in your tasks.json file any longer! You can reference the built-in problem matcher in your test tasks by using the name $pester:
    {
        "taskName": "Test",
        "suppressTaskName": true,
        "isTestCommand": true,
        "showOutput": "always",
        "args": [ "Invoke-Pester -PesterOption @{IncludeVSCodeMarker=$true}" ],
        "problemMatcher": "$pester"
    }
NOTE: There is an issue with problem matchers when using the new 2.0.0 version of VS Code's task runner. Pester errors may show up multiple times in the Problems panel. This issue is being tracked at #797.
Other fixes and improvements
-
#710 - Variable definitions can now be found across the workspace
-
#771 - Improved dynamic comment help snippet performance in scripts with many functions
-
#786 - Running the "Show Integrated Console" command will now start the extension if it isn't already started
-
#774 - Pressing Enter now causes custom prompt functions to be fully evaluated
-
#770 - Fixed issue where custom prompt function might be written twice when starting the integrated console
-
#767 - Fixed placeholder navigation for many built-in snippets
-
#782 - Fixed extension host crash when restarting the PowerShell session
-
#737 - Fixed hangs and high CPU when restarting or switching between PowerShell sessions
-
#777 - Changed "Starting PowerShell" message to clearly indicate that we're in the PowerShell Integrated Console
v1.1.0
New dynamic snippet for adding comment-based help (#748)
We've added a really cool new feature that enables you to create comment-based help blocks with ease! When you've defined a function in a PowerShell script file, you can now start typing a comment block above the function definition and it will be completed for you:

This comment block works like a snippet, allowing you to tab through the fields to quickly add documentation for the parts you care about.
This is a first pass for this feature and we plan to do more with it in the future. Please feel free to file feature requests for anything else you'd like to see!
Breakpoints hit in the Integrated Console now activate the debugger UI (#619)
In previous releases it was necessary to start the "PowerShell Interactive Session" debugging configuration before you could run a command or script from the Integrated Console and hit breakpoints in the editor UI. We've just removed this limitation!
Now when you set a breakpoint using Set-PSBreakpoint and run a script or command in the Integrated Console, the debugger UI now gets activated:

Note that breakpoints set in the Integrated Console still do not show up
in the editor UI; this requires changes to VS Code that we'll be contributing for their next feature release.
Improved output when loading profile scripts (#663 and #689)
We now write the errors and Write-Output calls that occur while loading profile scripts so that it's easier to diagnose issues with your profile scripts. This fix will help us identify the things missing from the Integrated Console which cause your profile scripts to fail (like the current lack of a PrivateData object for setting console colors).
Please feel free to file issues for anything that causes your profile scripts to throw errors when they get loaded!
Other fixes and improvements
-
#751 - Removed keybinding for the "Find PowerShell Modules from the Gallery" command because it conflicts with VS Code's default "Format Selection" keybinding.
-
#739 - Fixed wording of PowerShell extension commands to have consistent capitalization. Thanks to @AndySchneiderDev for the contribution!
v1.0.0
We are excited to announce that we've reached version 1.0! For more information, please see the official announcement on the PowerShell Team Blog.
New script argument UI when debugging (#705)
You can now set PowerShell debugger configurations to prompt for arguments to be passed to your script when it is executed. This is configured using the new ${command:SpecifyScriptArgs} configuration variable in launch.json:
        {
            "type": "PowerShell",
            "request": "launch",
            "name": "PowerShell Launch DebugTest.ps1 w/Args Prompt",
            "script": "${workspaceRoot}/DebugTest.ps1",
            "args": [ "${command:SpecifyScriptArgs}" ],
            "cwd": "${file}"
        }
When you launch this configuration you will see a UI popup asking for arguments:

You can type your arguments to the script as you would in PowerShell:
-Count 5
In future executions of this configuration, you will be presented with the arguments you typed the last time you ran it so that you can easily edit them and test variations!
New hash table alignment formatting rule (#672)
We've added a new code formatting rule that automatically aligns the equal sign in assignments of keys in hash tables or DSC configurations. It also works with nested hash tables! Here's a simple example:
Before
$formatTest = @{
    Apple = 4
    Tangerine = @{
        Orange = 2
        CornflowerBlue = 6
    }
    Banana = 3
}
After
$formatTest = @{
    Apple     = 4
    Tangerine = @{
        Orange         = 2
        CornflowerBlue = 6
    }
    Banana    = 3
}
This formatting rule is enabled by default but can be disabled with the following setting:
"powershell.codeFormatting.alignPropertyValuePairs": false
Added basic module-wide function references support
In the past, finding the references or definition of a function in FileA.ps1 only worked if FileA.ps1 had an explicit dot-source invocation of FileB.ps1. We have removed this limitation so that you can now find definitions and references of any function across all the script files in your project folder! This is especially useful if you write PowerShell modules where all of the source files are dot-sourced inside of the .psm1 file.
This new implementation is very basic and may give unexpected results, so please file an issue on GitHub if you get a result you did not expect!
Other integrated console and debugger improvements
-
Fixed #698 - When debugging scripts in the integrated console, the cursor position should now be stable after stepping through your code! Please let us know if you see any other cases where this issue appears.
-
Fixed #626 - Fixed an issue where debugging a script in one VS Code window would cause that script's output to be written to a different VS Code window in the same process.
-
Fixed #618 - Pressing enter on an empty command line in the Integrated Console no longer adds the empty line to the command history.
-
Fixed #617 - Stopping the debugger during a prompt for a mandatory script parameter no longer crashes the language server.
-
Fixed PowerShellEditorServices #428 -
Debugger no longer hangs when you stop debugging while an input or choice prompt is active in the integrated console.
v0.12.2
-
Fixed #662 - Changed usage of
$env:PSMODULEPATHto$env:PSModulePathto conform to a recent change in PowerShell 6 (PowerShell/PowerShell#3255) which makes the casing ofPSModulePathconsistent between Windows and the *NIX platforms.NOTE: This is a breaking change for PowerShell extension users on Linux and macOS
If you are using PowerShell 6.0.0-alpha.17 or lower you will need to upgrade to 6.0.0-alpha.18.
-
Fixed #645 - "Go to Definition" or "Find References" now work in untitled scripts without crashing the session
-
Fixed #632 - Debugger no longer hangs when launched while PowerShell session is still initializing
-
Fixed #655 - Fixed an issue with current working directory being set incorrectly when debugging untitled script files
-
Fixed PowerShellEditorServices #430 - Resolved occasional IntelliSense slowness by preventing the implicit loading of the PowerShellGet and PackageManagement modules. This change will be reverted once a bug in PackageManagement is fixed.
-
Fixed PowerShellEditorServices #427 - Fixed an occasional crash when requesting editor IntelliSense while running a script in the debugger
-
Fixed PowerShellEditorServices #416 - Cleaned up errors that would appear in the
$Errorsvariable from the use ofGet-CommandandGet-Helpin IntelliSense results
v0.12.1
v0.12.0
Debugging untitled files (#555)
You can now debug untitled files that are set to the PowerShell language mode. When you
create a new untitled file, use the "Change Language Mode" command (Ctrl+K M)
and choose "PowerShell" from the menu that appears. You can now press F5 to start
debugging the script file without saving it.
In the upcoming 1.11.0 release of Visual Studio Code (or in the current VS Code Insiders
release), you can configure the new files.defaultLanguage setting to powershell in either
your User or Workspace settings to cause all untitled files to be created with the PowerShell
mode by default. This will allow you to create new PowerShell scripts and debug them
immediately without saving first!
New right-click context menu for Run Selection (#581)
By user request, we've also added a new "Run Selection" item in the right-click context menu
for PowerShell script files:

Debugging improvements
-
Fixed #620 -
PowerShell session now does not crash when a breakpoint is hit outside of
debug mode -
Fixed #614 - Auto variables are now populating correctly in the debugger. NOTE: There is a known issue where all of a script's variables begin to show up in the Auto list after running a script for the first time. This is caused by a change in 0.11.0 where we now dot-source all debugged scripts. We will provide an option for this behavior in the future.
-
Fixed #641 - PowerShell script files with capitalized extensions (.PS1, .PSM1) can now be launched in the debugger
-
Fixed #616 - Debugger now shows column position indicators when debugging pipelines or nested expressions:

Integrated console improvements
- Fixed PowerShell/PowerShellEditorServices#411 - Commands run outside of the integrated console prompt now interrupt the prompt correctly. This resolves a class of issues that appear when running commands in the extension like "New Project from Plaster Template" or any
$psEditorcommands added with the "Register-EditorCommand" function. Running any of these commands will now cause the current input prompt to be cancelled so that the command's output will be written correctly.
Code formatting improvements
-
Fixed #595 - High CPU usage when using formatOnType has now been resolve
-
Fixed #559 - The
newLineAfterCloseBracebehavior has been improved to respect common syntax usages -
FixedPowerShell/PowerShellEditorServices#380 - The
whitespaceBeforeOpenBracebehavior now leaves "magic" functions with the correct formatting. For example:(0 .. 10).foreach{$_}now does not have a whitespace inserted before the{.
New Project with Plaster improvements
-
Fixed #643 - Running Plaster using the New Project command now interrupts the command prompt correctly
-
Fixed #504 - Confirming default values in Plaster input prompts by pressing Enter now works correctly
Other fixes and improvements
-
Added #639 and #640 - Our configuration setting descriptions have been edited for superior clarity thanks to June Blender!
-
Fixed #611 - Example-* snippets are now displaying correctly in IntelliSense results
-
Added #624 - When you update the PowerShell extension after this release, you will now see version update indicators which offer to display the changelog in a preview tab
v0.11.0
Remotely edited files can now be saved
- Added #583 -
When you open files in a remote PowerShell session with thepseditcommand,
their updated contents are now saved back to the remote machine when you save
them in the editor.
Integrated console improvements
-
Fixed #533 -
The backspace key now works in the integrated console on Linux and macOS. This
fix also resolves a few usability problems with the integrated console on all
supported OSes. -
Fixed 542 -
Get-Credential now hides keystrokes correctly on Linux and macOS.
We also added some new settings (#580,
#588) to allow fine-tuning
of the integrated console experience:
-
powershell.startAutomatically(default:true) - If true, causes PowerShell extension
features to start automatically when a PowerShell file is opened. If false, the user must
initiate startup using the 'PowerShell: Restart Current Session' command. IntelliSense,
code navigation, integrated console, code formatting, and other features will not be
enabled until the extension has been started. Most users will want to leave this
setting totrue, though it was added to save CPU cycles if you often use new VS Code
instances to quickly view PowerShell files. -
powershell.integratedConsole.showOnStartup(default:true) - If true, causes the
integrated console to be shown automatically when the PowerShell extension is initialized. -
powershell.integratedConsole.focusConsoleOnExecute(default:true) - Iftrue,
causes the integrated console to be focused when a script selection is run or a
script file is debugged.
Interactive debugging improvements
-
Added #540 -
The scripts that you debug are now dot-sourced into the integrated console's
session, allowing you to experiment with the results of your last execution. -
Added #600 -
Debugger commands likestepInto,continue, andquitare now available
in the integrated console while debugging a script. -
Fixed #596 -
VS Code's Debug Console now warns the user when it is used while debugging
a script. All command evaluation now happens through the integrated console
so this message should help alleviate confusion.
Other fixes and improvements
- Fixed #579 -
Sorting of IntelliSense results is now consistent with the PowerShell ISE - Fixed #591 -
"Editor commands" registered with theRegister-EditorCommandfunction are
now sorted alphabetically by theirNamefield, causing commands to be grouped
based on their source module. - Fixed #575 -
The interactive console no longer starts up with errors in the$Errorvariable. - Fixed #599 -
The SSASCMDLETS module
from SQL Server Analytics Service should now load correctly in the integrated
console.
v0.10.0: Merge pull request #537 from PowerShell/release/0.10.0
New interactive console experience
We are excited to provide you with the first release of our new interactive
console experience! When you open up a PowerShell script file, you will
be greeted with a new VS Code integrated terminal window called
"PowerShell Integrated Console"

In this console you will have an experience that falls somewhere between
the PowerShell ISE and the PowerShell console host:
- Tab completion of commands and their parameters
- Basic command history, accessed using the up/down arrow keys
- The
pseditcommand opens existing files in an editor pane - Pressing F8 in an editor pane runs the current line or selection in the console
- Native applications like
gitare fully supported - Script debugging shares the same console session with the editor for
a true ISE-like debugging experience
It even works with your fancy prompt function if configured in your
VS Code profile ($HOME\Documents\WindowsPowerShell\Microsoft.VSCode_profile.ps1):

The integrated console is supported on PowerShell v3 through v6 and works
on Linux and macOS with PowerShell Core. By default you don't have to
configure which PowerShell to run, we will pick an appropriate default
based on your platform. If you'd like to choose a different install
of PowerShell you can always change the powershell.developer.powerShellExePath
setting.
Keep in mind that this is the first release for this feature and there are
bound to be issues and missing functionality. Please feel free to file
GitHub issues for any bugs or feature requests!
Known Issues and Limitations
- #535 PSReadline
is currently not supported in the integrated console. We will enable this
in a future release. - #534 Integrated console
prompt is not restarted when you stop the debugging of a local runspace in another
process. This will be addressed soon in a patch update. - #533 Backspace key
does not work in the integrated console on Linux and macOS. The workaround for now
is to use Ctrl+H instead of the Backspace key. This will be addressed
soon in a patch update. - #536 Integrated console
sometimes does not have a scrollbar at startup. The workaround is to resize the width
of the VS Code window slightly and the scrollbar will appear. This will be addressed
soon in a patch update.
Get-Credential and PSCredential support
Now that we have the integrated console, we have added support for the Get-Credential
cmdlet, Read-Host -AsSecureString, and any input prompt of type SecureString or PSCredential.
When you run any of these cmdlets you will be prompted inside the integrated console:

Code formatting improvements
We now support VS Code's editor.formatOnType setting so that your code gets formatted
as you type! Formatting will be triggered when you press Enter or the closing curly
brace character }.
Based on your feedback, we've also added new code formatting options, all of which
are turned on by default:
powershell.codeFormatting.newLineAfterCloseBrace- Causes a newline to be inserted
after a closing brace in multi-line expressions like if/elsepowershell.codeFormatting.whitespaceBeforeOpenBrace- Causes whitespace to be
inserted before an open brace likeForeach-Object {powershell.codeFormatting.whitespaceBeforeOpenParen- Causes whitespace to be
inserted before an open parentheses likeif (powershell.codeFormatting.whitespaceAroundOperator- Causes whitespace to be
inserted around operators like=or+powershell.codeFormatting.whitespaceAfterSeparator- Causes whitespace to be
inserted around separator characters like;and,powershell.codeFormatting.ignoreOneLineBlock- Single-line expressions, like
small if/else statements, will not be expanded to multiple lines.
We've also made many improvements to the performance and stability of the formatter.
Debugging improvements
We've added a new configuration for debugging your Pester tests. By default it
merely runs Invoke-Pester at the workspace path, but you can also edit the
configuation to add additional arguments to be passed through.
We've also added support for column breakpoints. Now you can set a breakpoint
directly within a pipeline by placing your cursor at any column on a line and
running the Debug: Column Breakpoint command:

For the latest PowerShell Core release (6.0.0-alpha.17),
we have also added the ability to step into ScriptBlocks that are executed on another
machine using Invoke-Command -Computer.
Set a breakpoint on an Invoke-Command line and then once it's hit:

Press F11 and you will step into the ScriptBlock. You can now continue to use
"step in" and trace the ScriptBlock's execution on the remote machine:

Note that you cannot currently set breakpoints in the script listing file as
this code is being executed without an actual script file on the remote machine.
Other fixes and improvements
- Fixed #427 -
The keybinding for "Expand Alias" command has been changed to Shift+Alt+E - Fixed #519 -
Debugger hangs after continuing when watch expressions are set - Fixed #448 -
Code formatter should keep indentation for multi-line pipelines - Fixed #518 -
Code formatter fails when dollar-paren$()expressions are used - Fixed #447 -
Code formatter crashes when run on untitled documents