It's possible to debug native code and managed code using the BrowserDebugProxy project.
Steps:
- Install C/C++ DevTools Support (DWARF) extension on chrome.
- Enable DWARF support: Open DevTools, click on the settings, click on experiments and enable WebAssembly Debugging: Enable DWARF support.

- Start the WebAssembly App Without Debugging from VS, or
dotnet runon command line. - Run chrome using this startup parameter:
--remote-debugging-port=9222 - Go to your Blazor App Page
- Press Ctrl-Alt-D (windows) it will open the debugger page
- It will show something like this in the Address Bar:
http://localhost:9222/devtools/inspector.html?ws=127.0.0.1:9300/devtools/page/97FCDA5A332CA3B72031790B26A264EF - Open another tab and go to
chrome://inspect
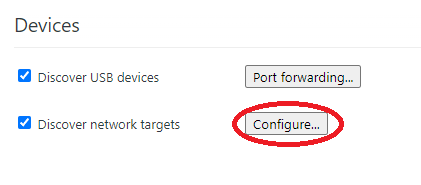
- Click on configure and add the port that was showed in the Address Bar:
127.0.0.1:9300

- After some seconds the tabs available to debug will appear
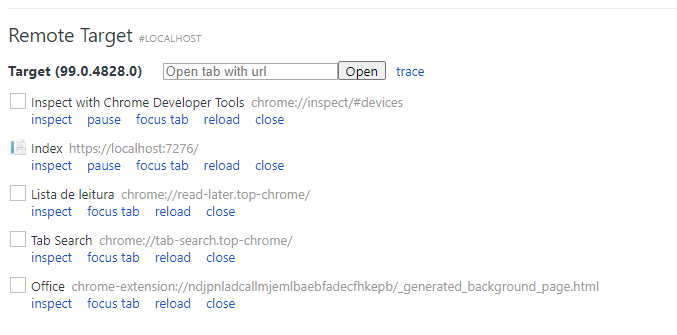
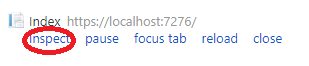
- Choose the WebAssembly Page and click on Inspect
- Open the Sources tab and click on
file:// - You will see c# files and c files available to add breakpoints.