Synthetic monitoring is a proactive approach to monitoring the performance, availability, and functionality of applications or systems. Unlike real-user monitoring, which relies on live user interactions, synthetic monitoring uses scripted tests or "synthetic transactions" that simulate user behavior to continuously check the health of your applications, APIs, or websites.
In Amazon CloudWatch, synthetic monitoring is implemented using canaries. Canaries are scripts that mimic user interactions with your system. AWS CloudWatch Synthetics allows you to:
- Test APIs and web applications for availability, latency, and functionality.
- Detect broken links, unexpected content changes, and more.
- Store monitoring results in Amazon S3 for analysis and integrate with CloudWatch Alarms for proactive alerts.
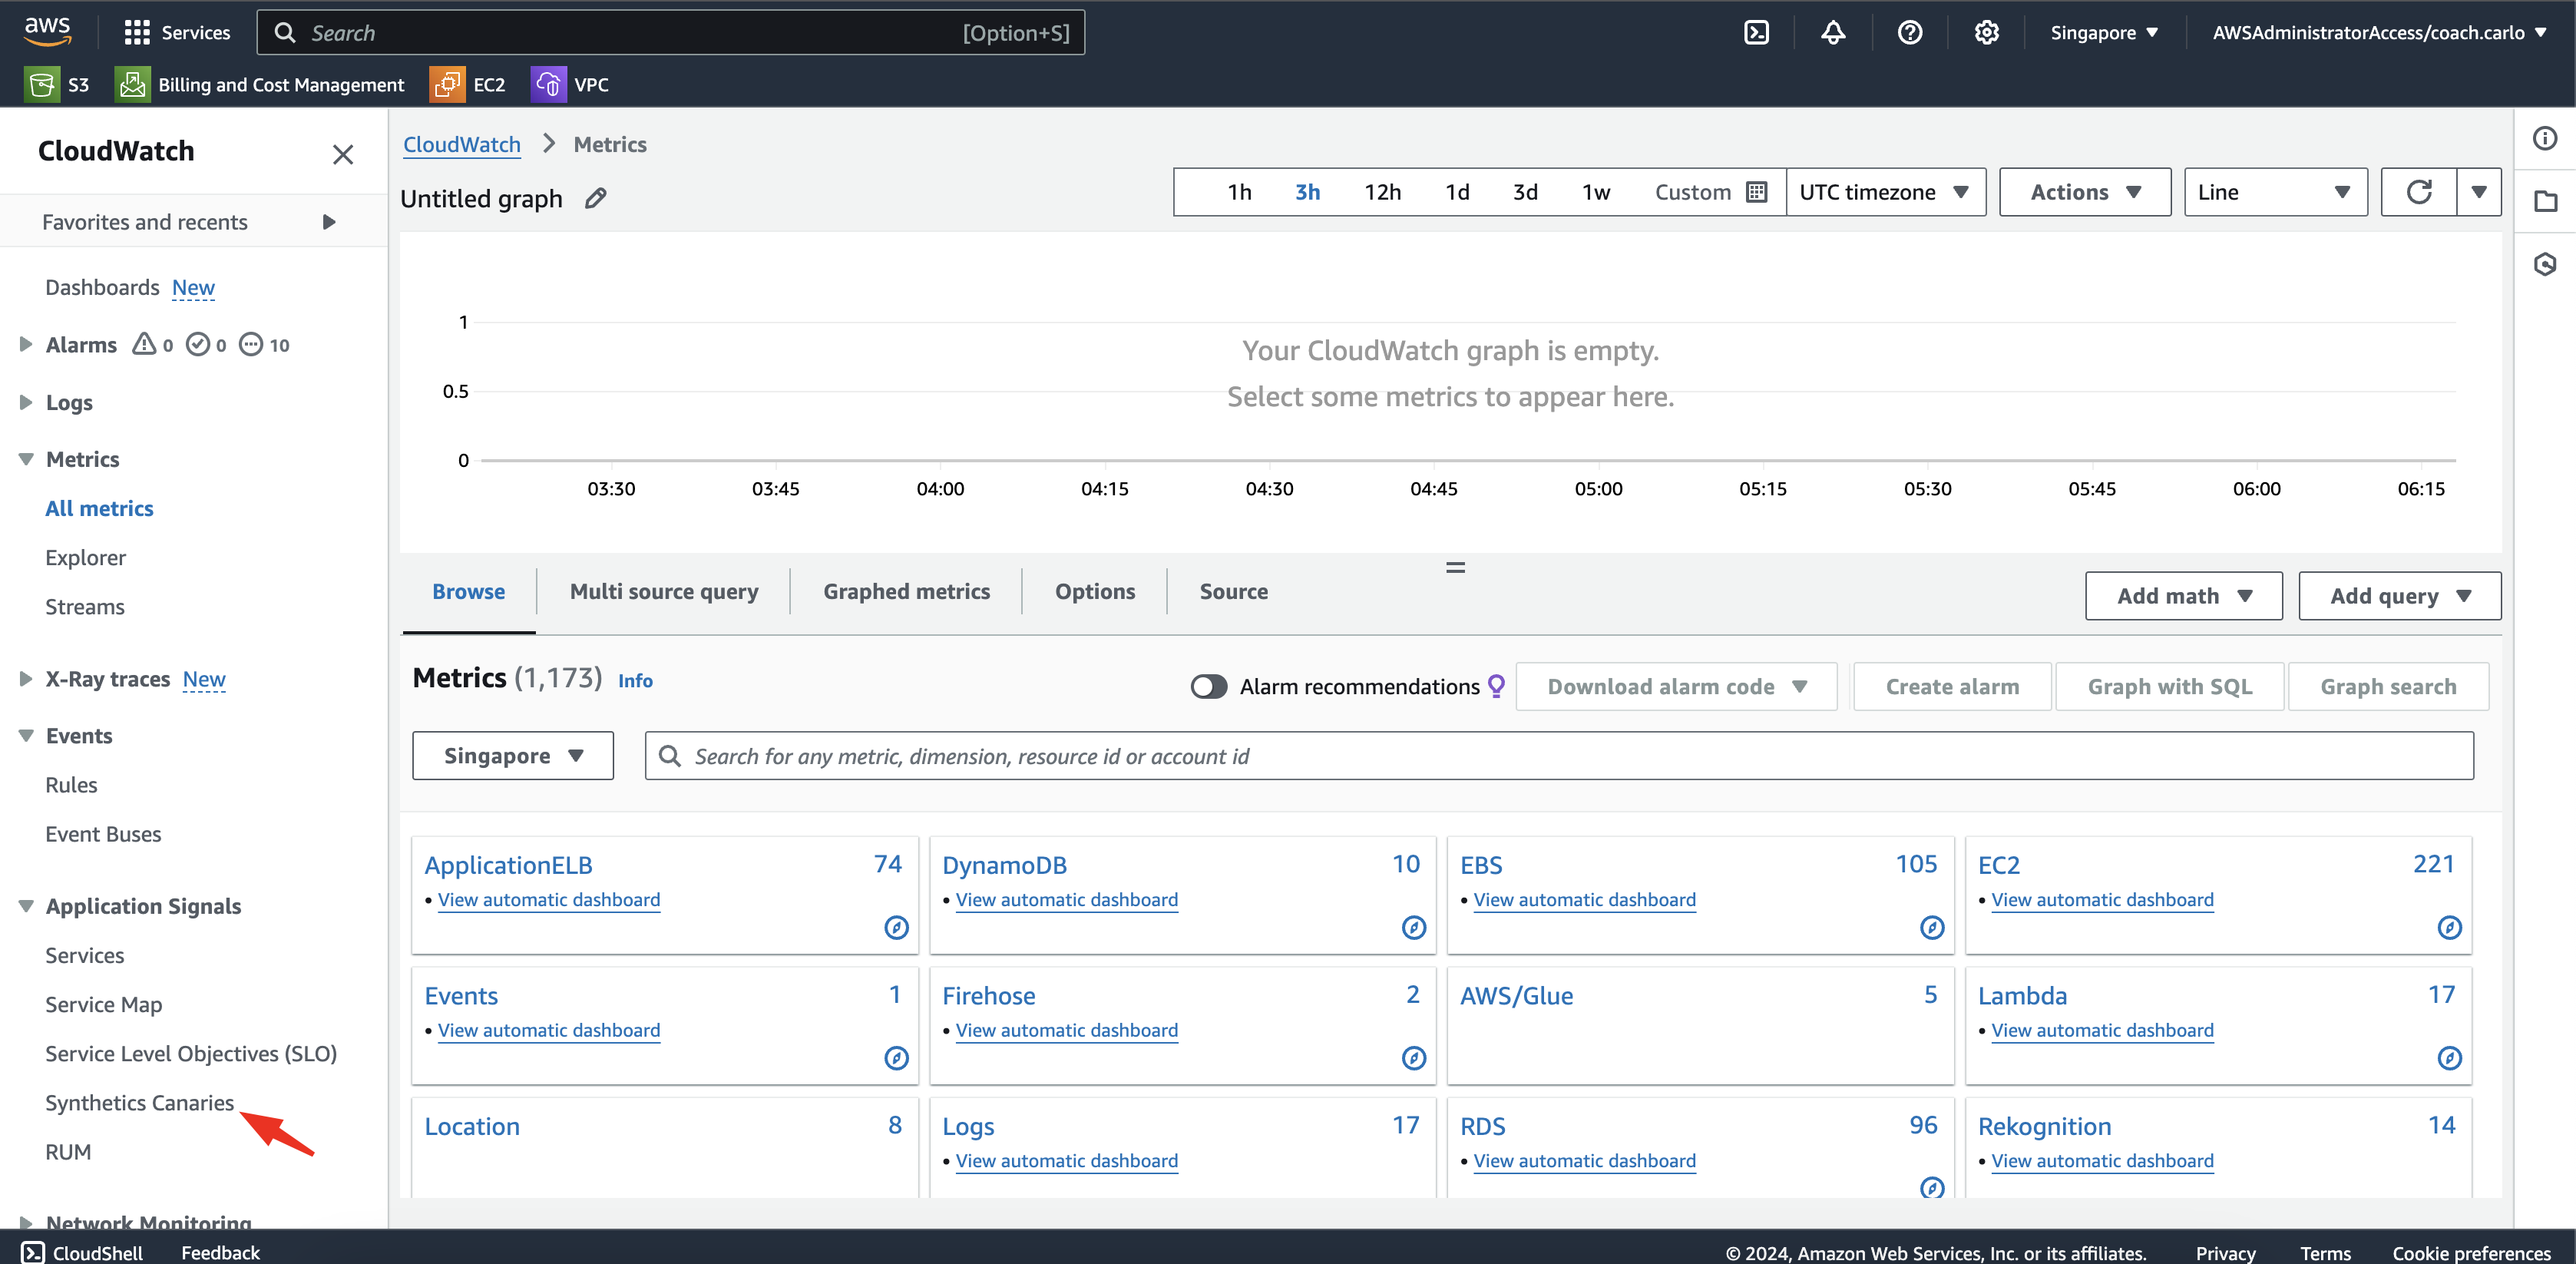
1-a. Access the AWS Management Console and enter CloudWatch on the search bar. 1-b. Once inside CloudWatch Console, under Applications Signals click on Synthetic Canaries
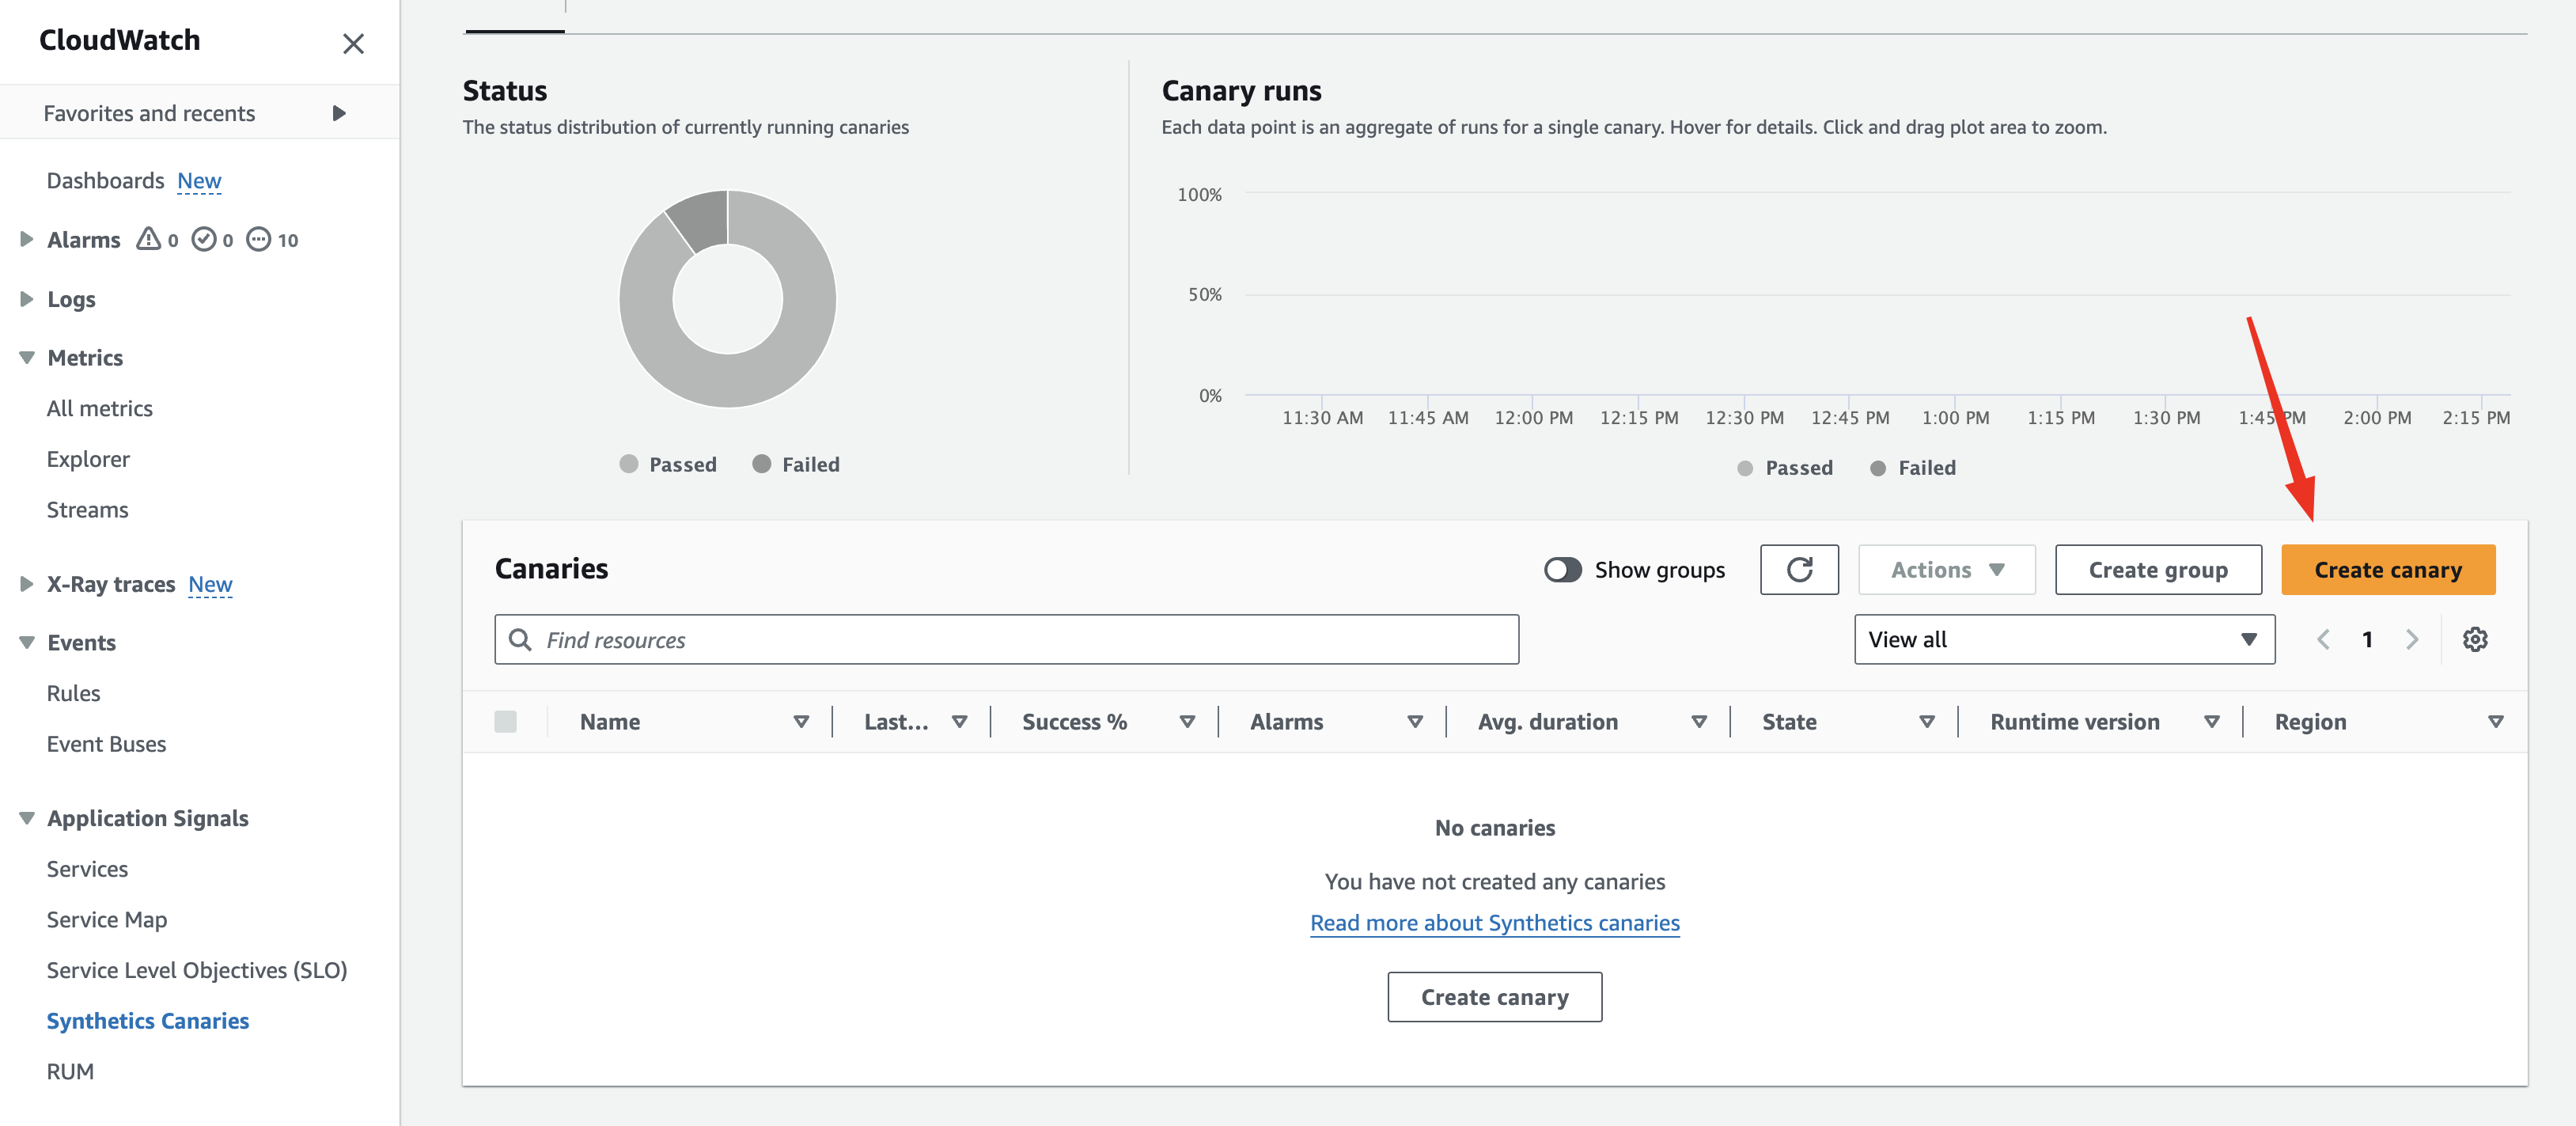
1-c. On the Canaries Section, click on Create Canary
Canaries are the scripts used for monitoring. This section lets you create, manage, and view canaries and their results.
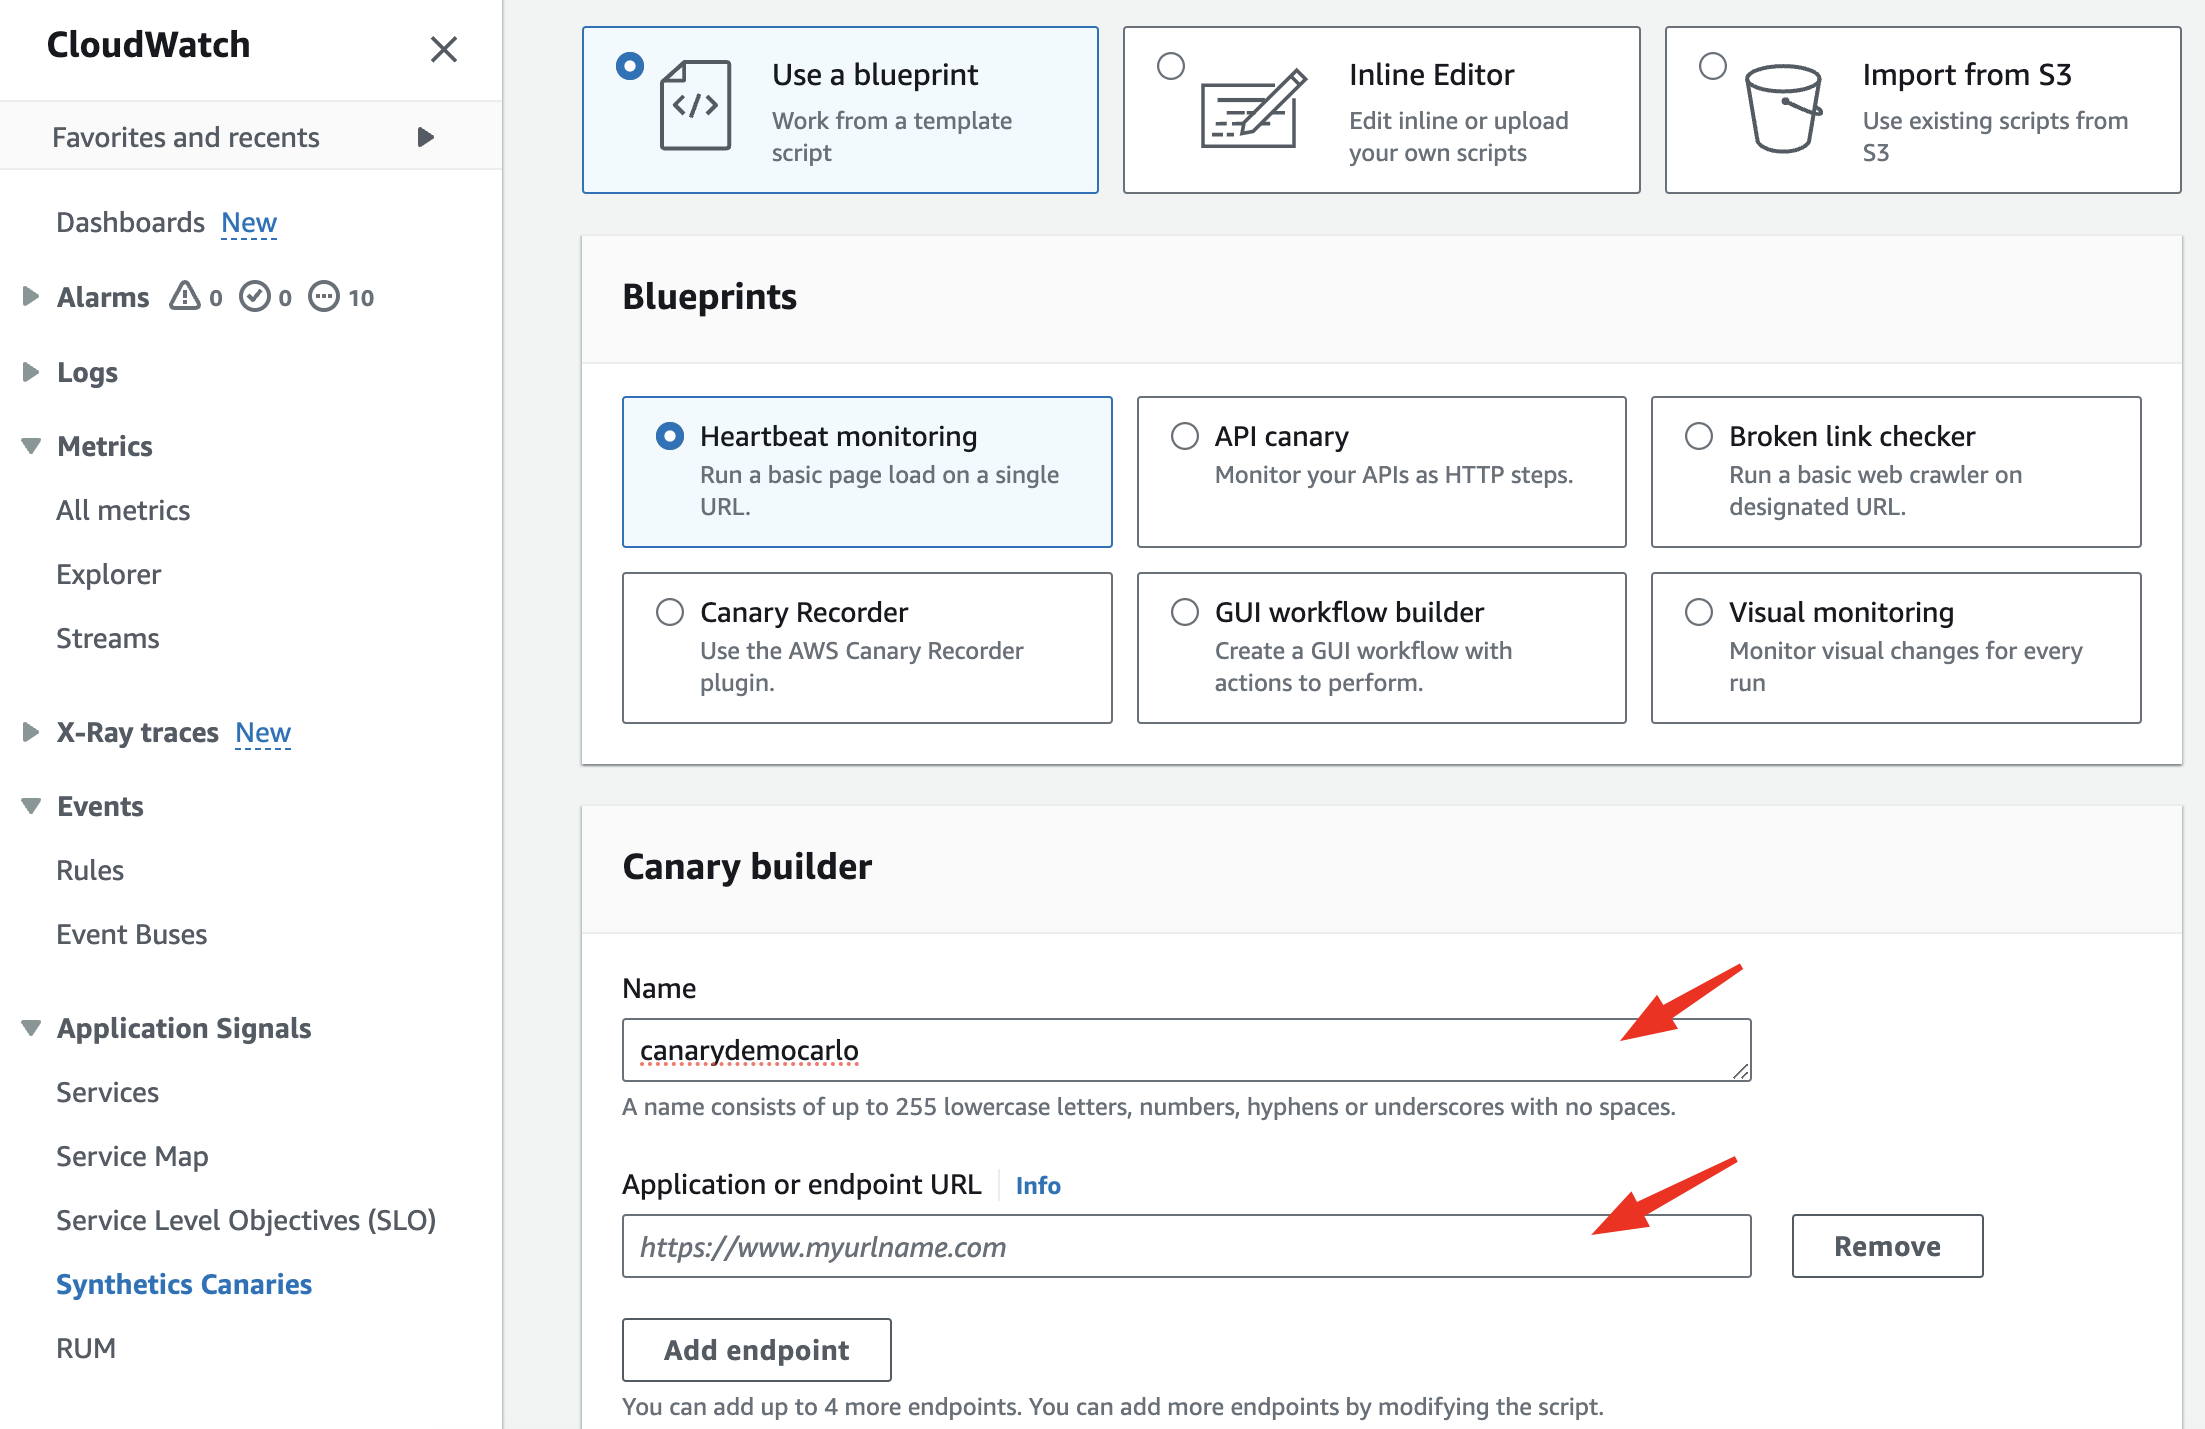
1-d. Under blueprint select Heartbeat and give it a name. Alternatively, Upload a Custom Script: Provide your own Node.js-based script for advanced scenarios.
Under application or endpoint URL, enter the URL: https://d362j91h2p2koz.cloudfront.net
This website runs the owasp juice shop same as what we provisioned last time.
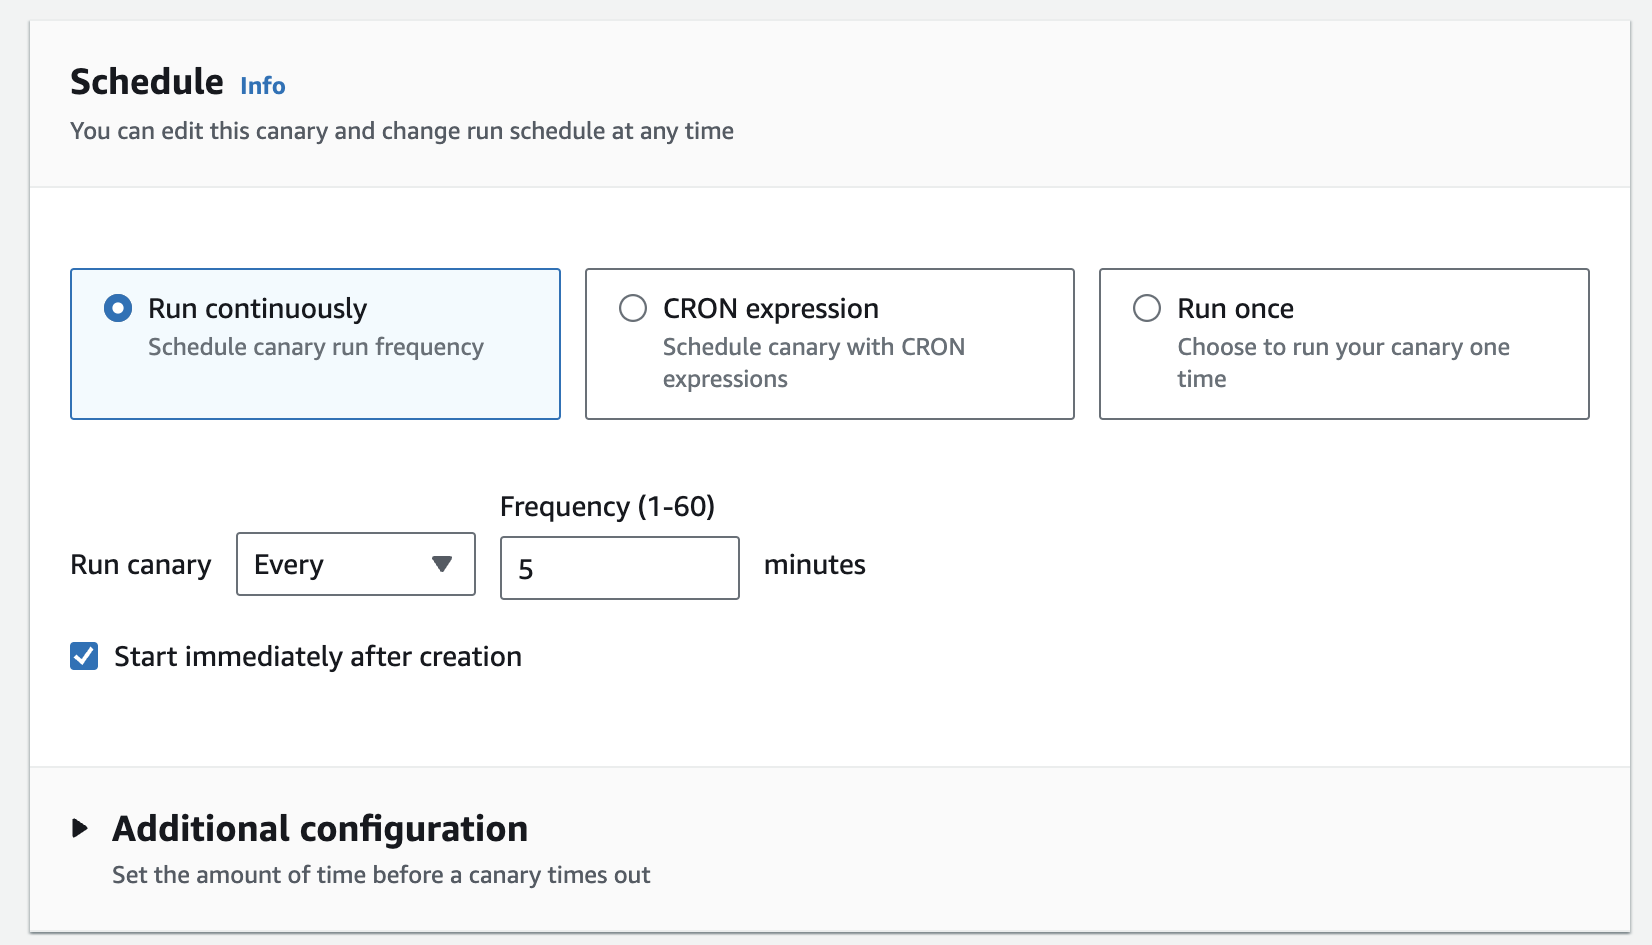
1-e. Under Schedule tab, choose a Frequency: Define how often the canary will run (e.g., every 5, 15, or 60 minutes). Alternatively you can use a Cron Expression for more granular scheduling if required.
For this activity choose 5 minutes.
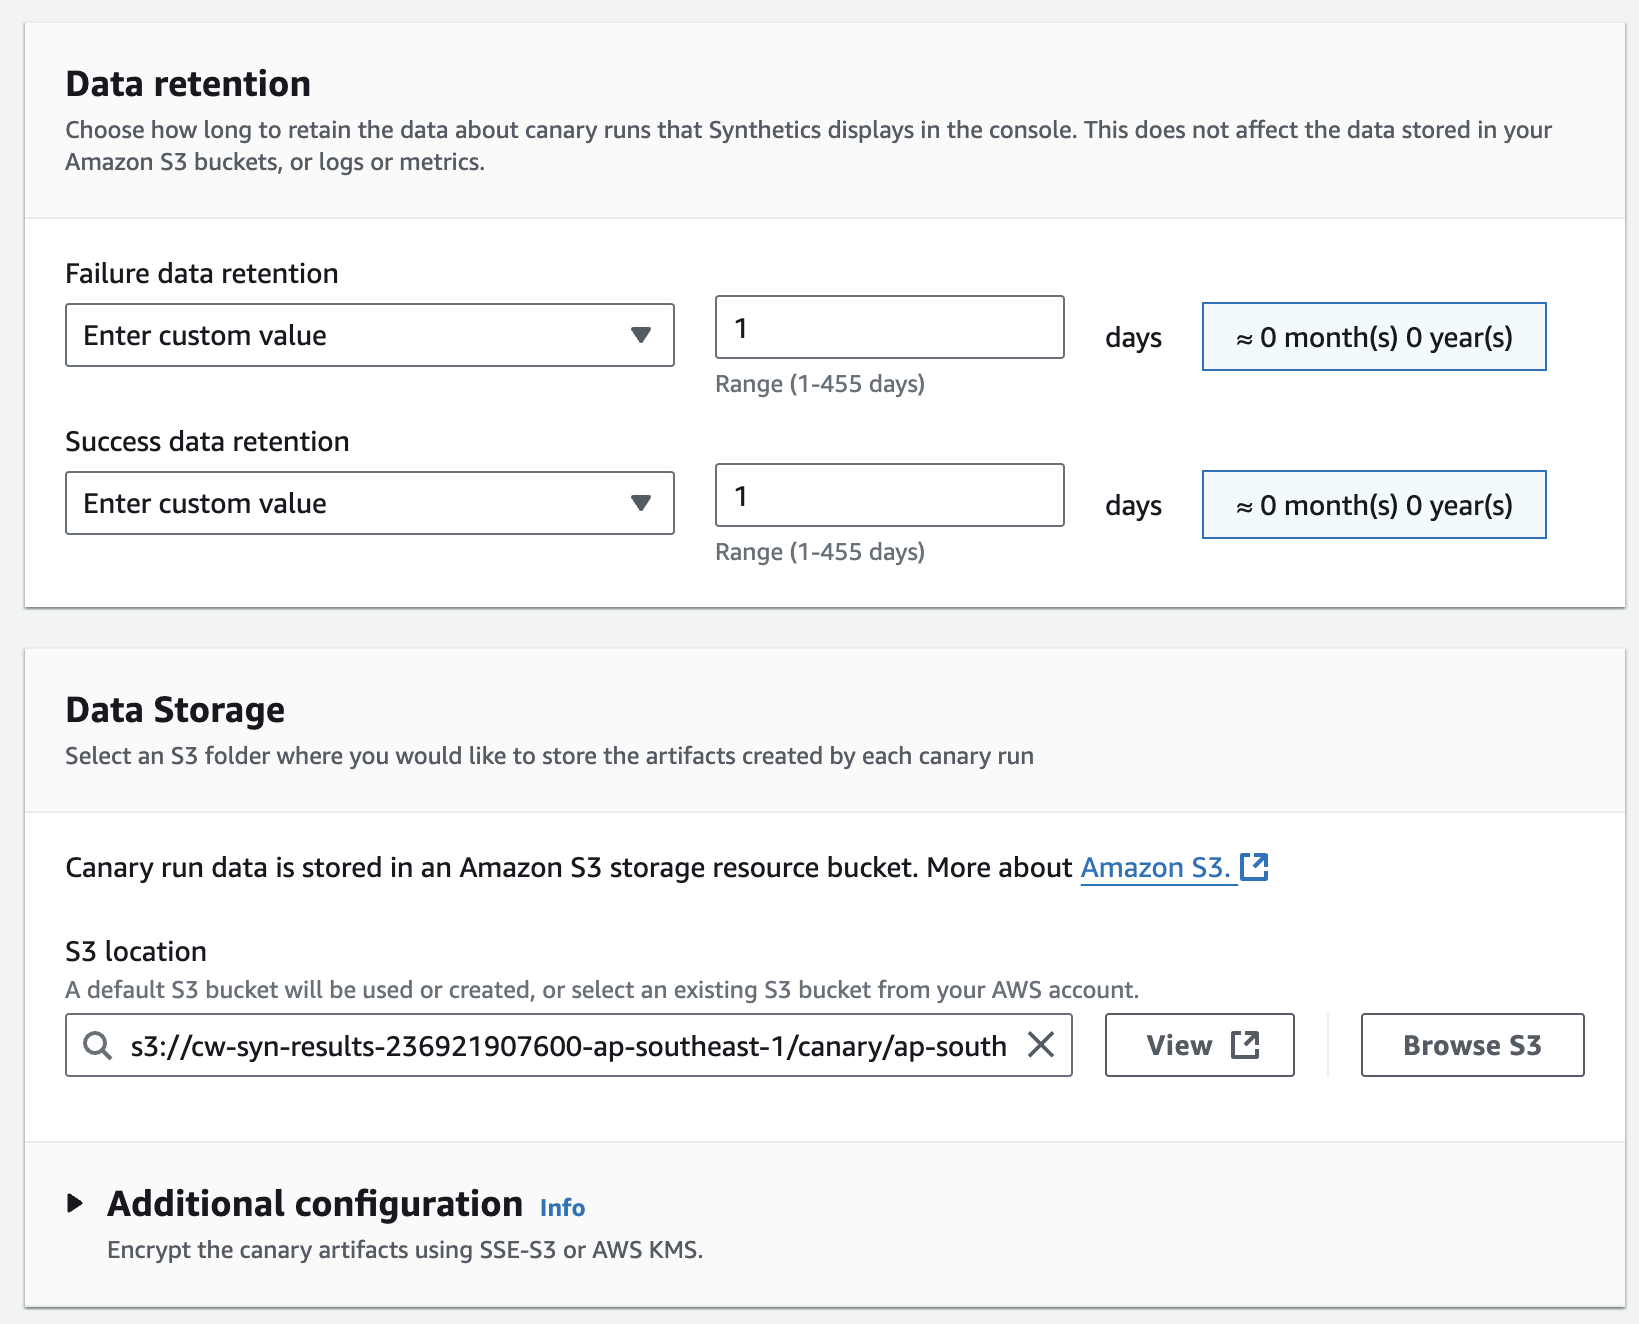
1-f. Under retention period, choose Custom and put 1 day. Note that this is because it is just a lab. If you need to retain your logs, make sure to comply with your company's standards.
1-g. Choose the default S3 bucket created for you which is entered automatically or choose a different s3 bucket intended for your logs if you have any.
1-h. Choose to create a new role for the service under Access Permission.
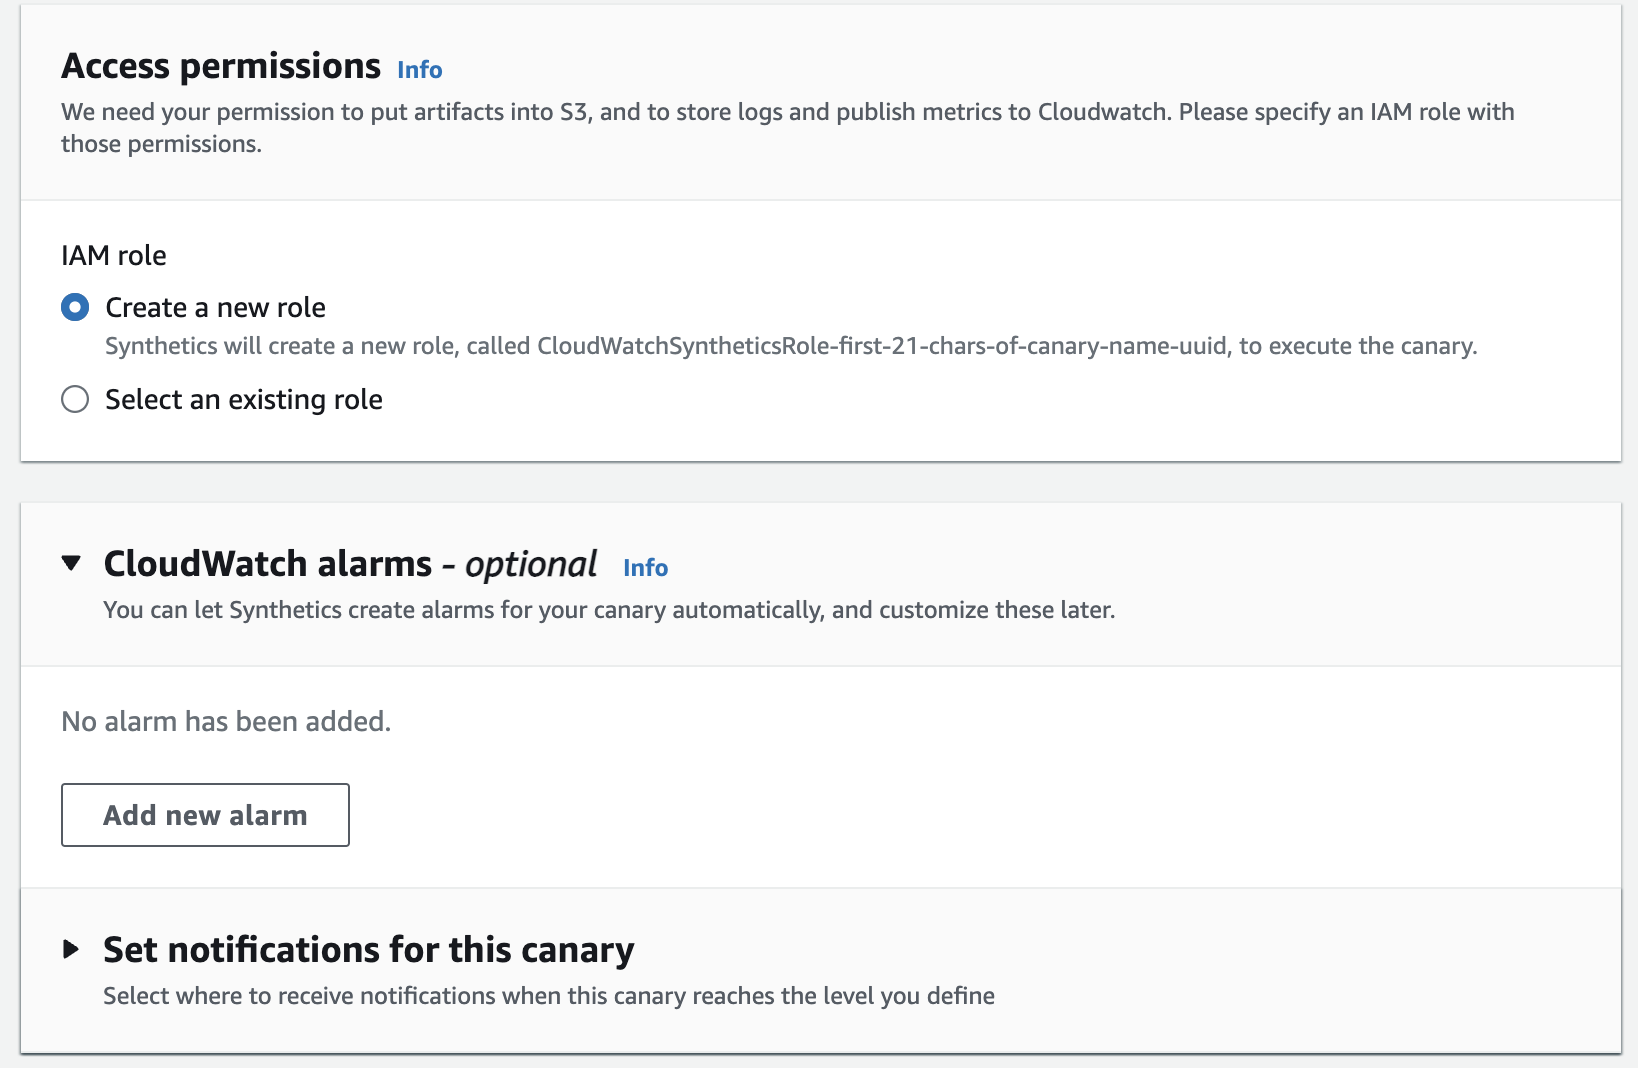
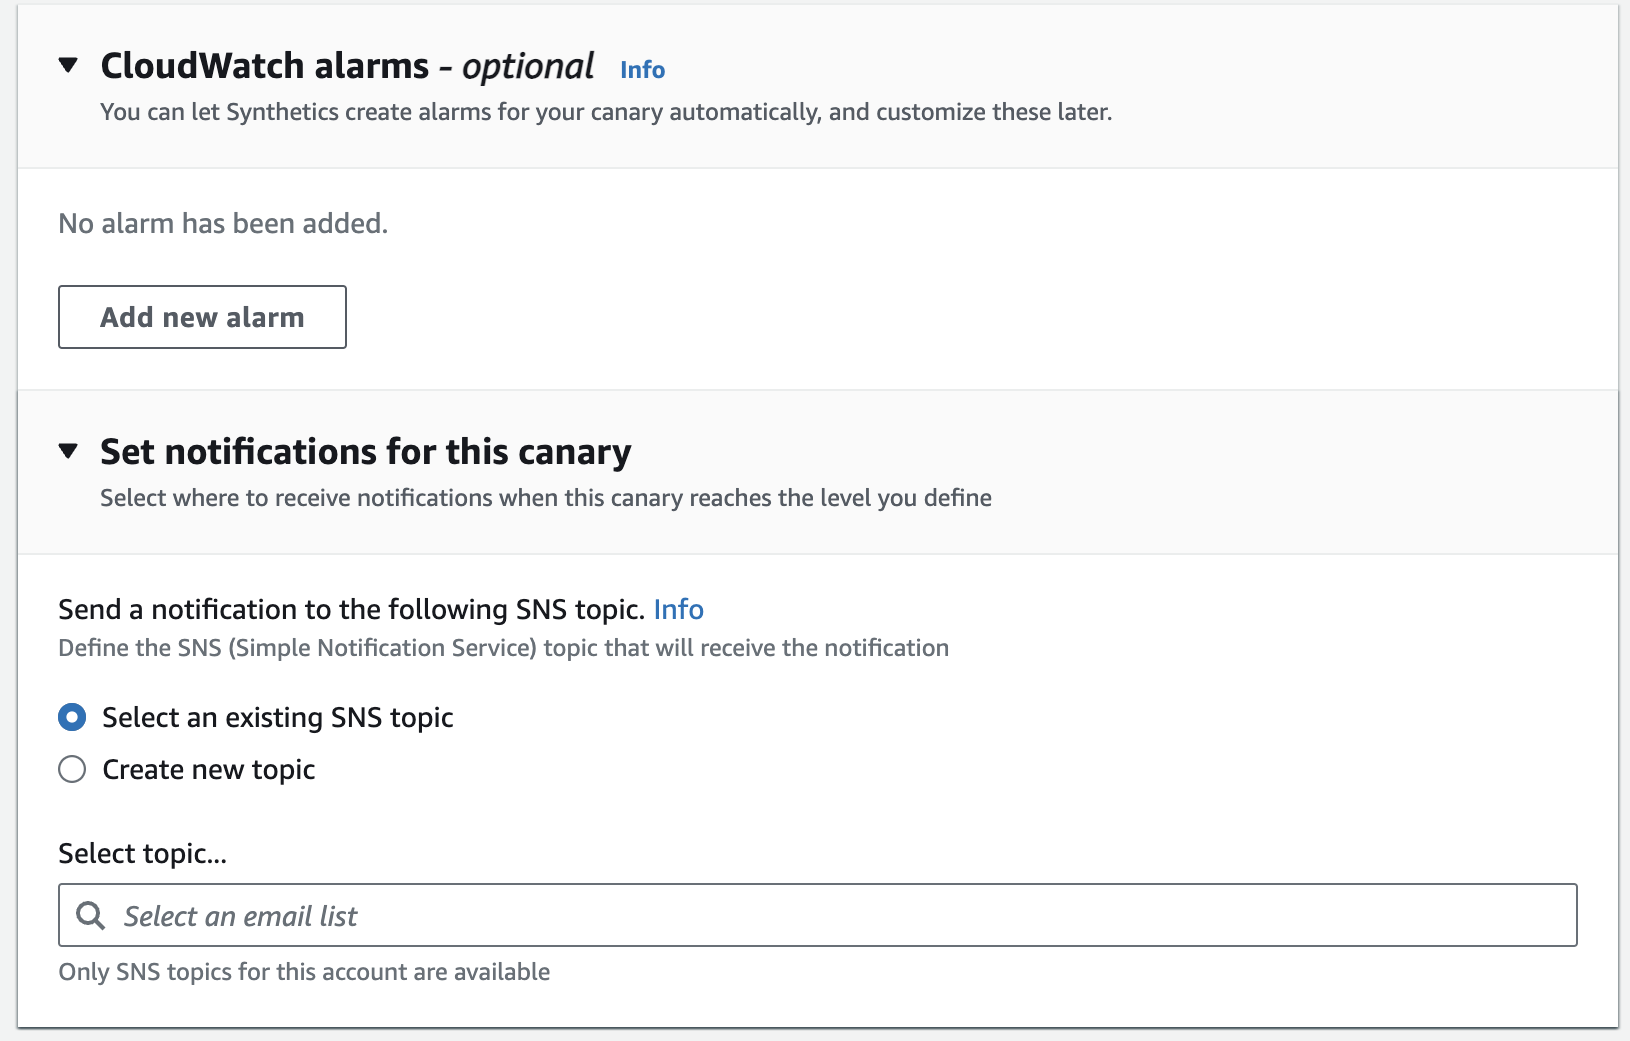
1-i. Under cloudwatch alarm, you can set a new alarm and connect it to an SNS topic you created. But for this lab, we don't have any so leave it.
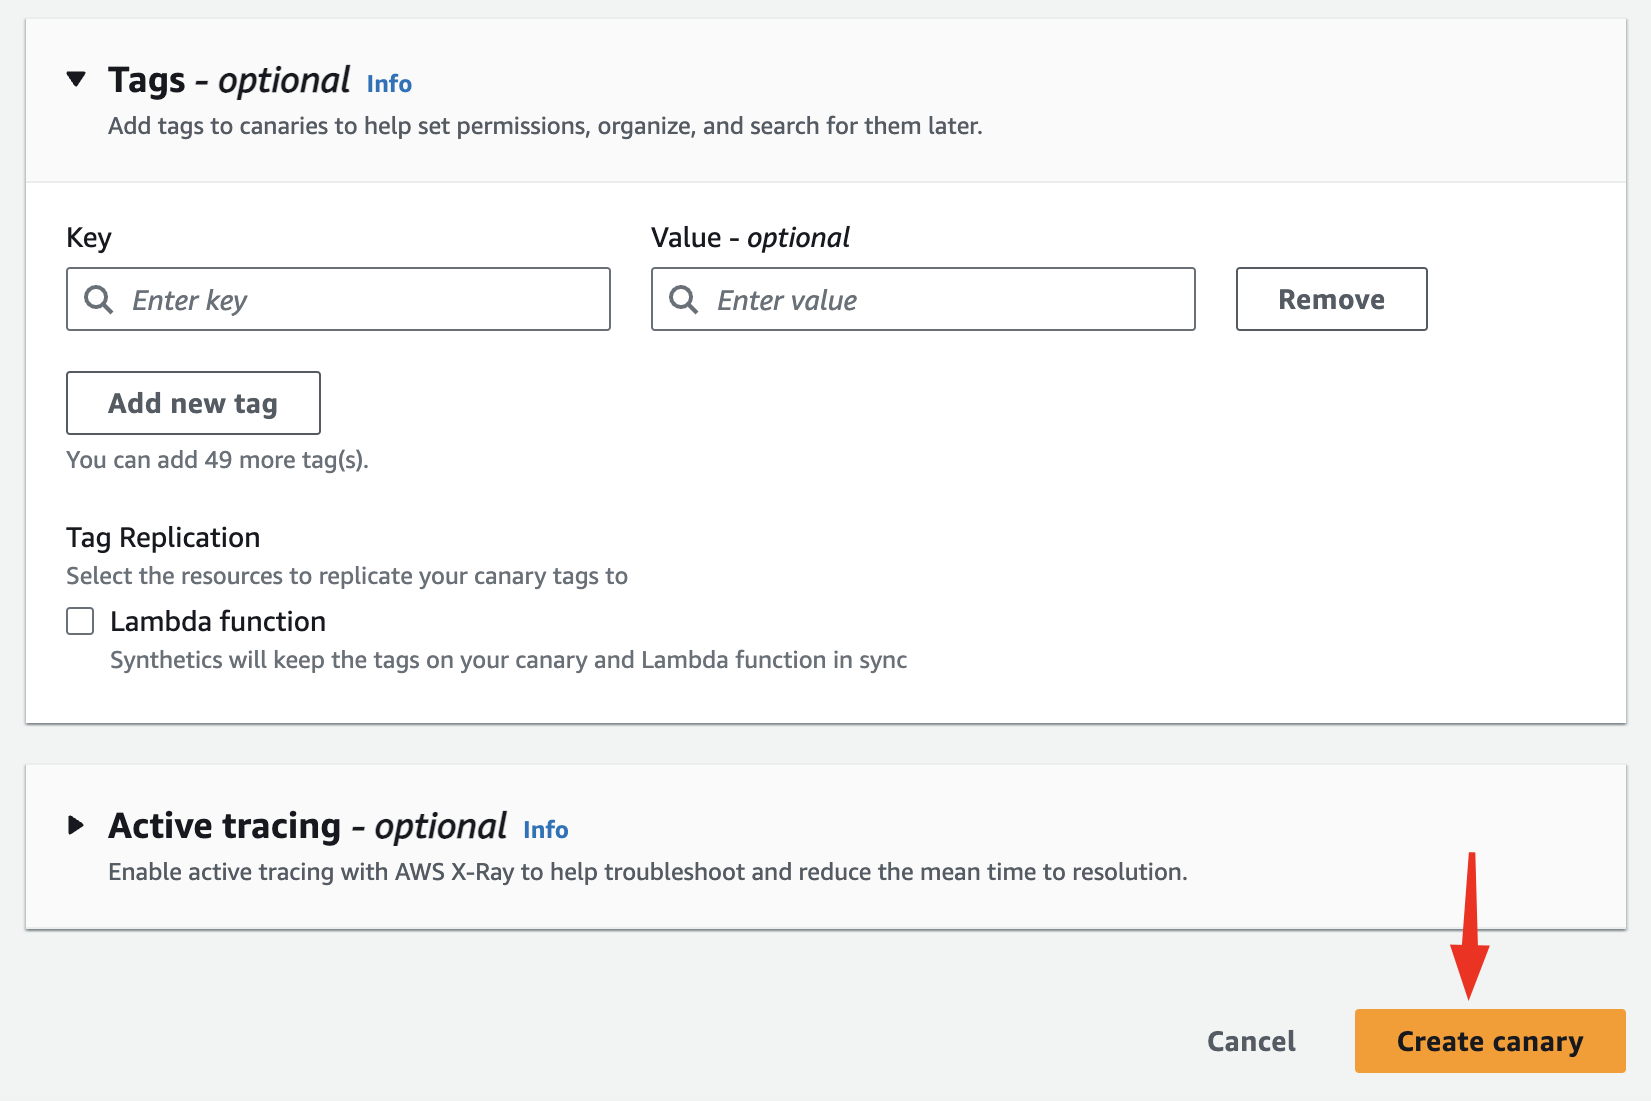
1-j. Finish creating the Canary.
2-a. Once the Canary is running you should see success/failure status on the dashboard.
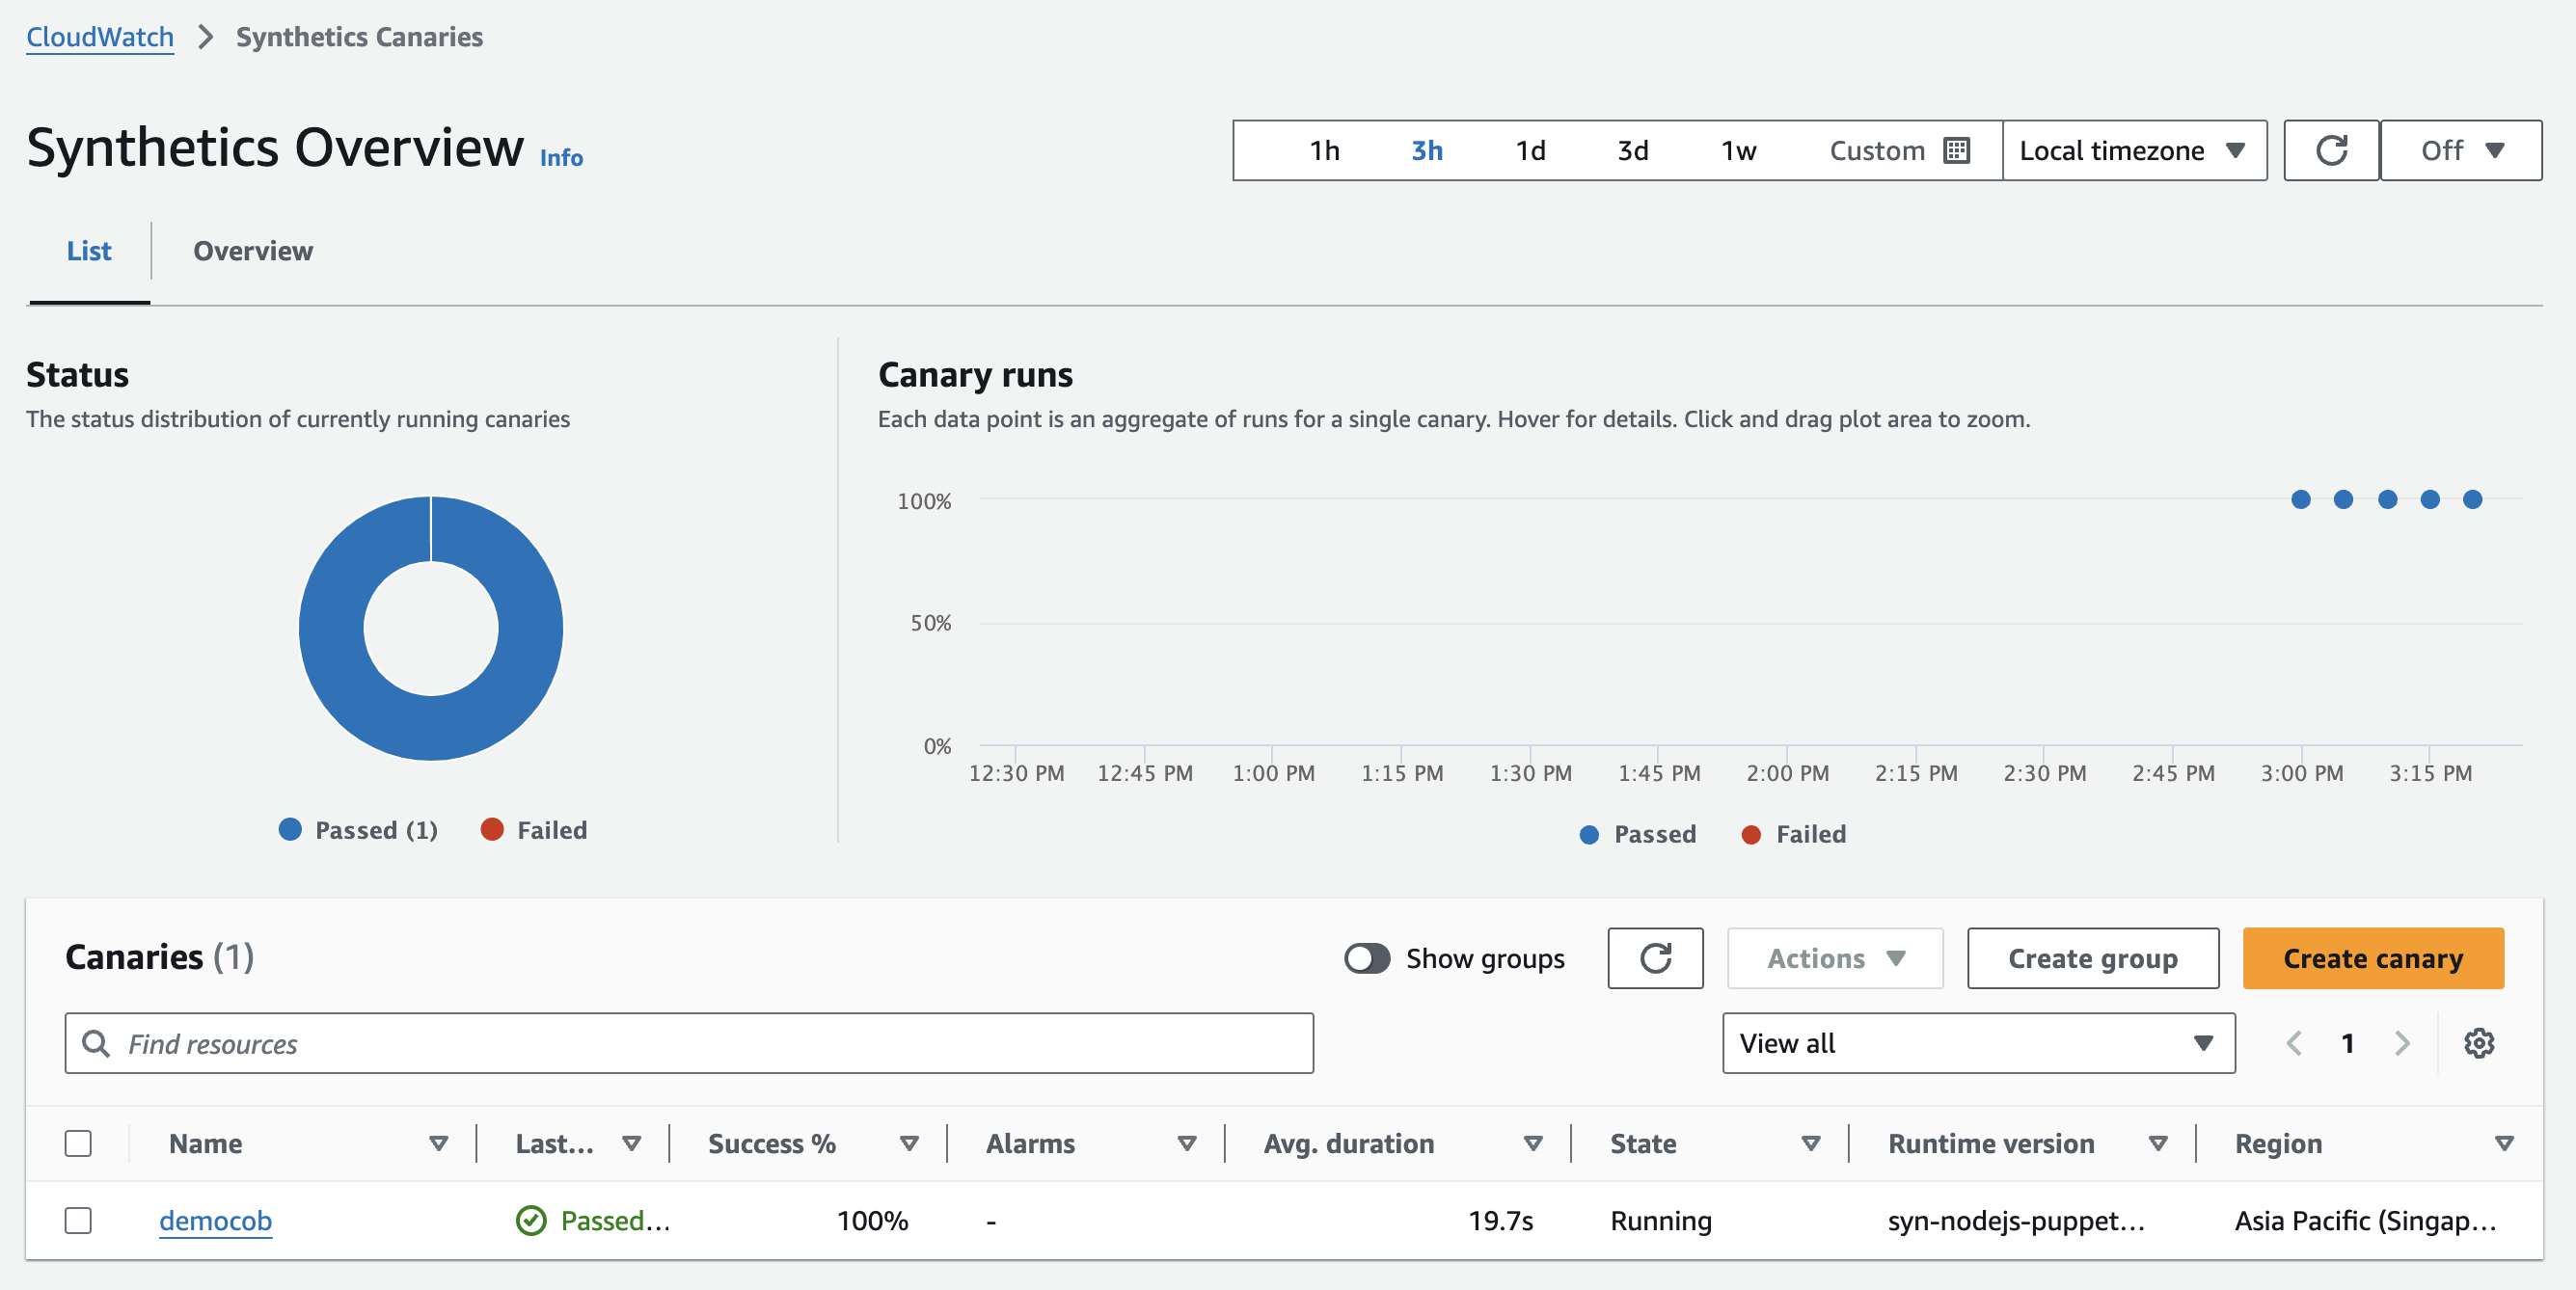
2-b. Click on the Canary you created.
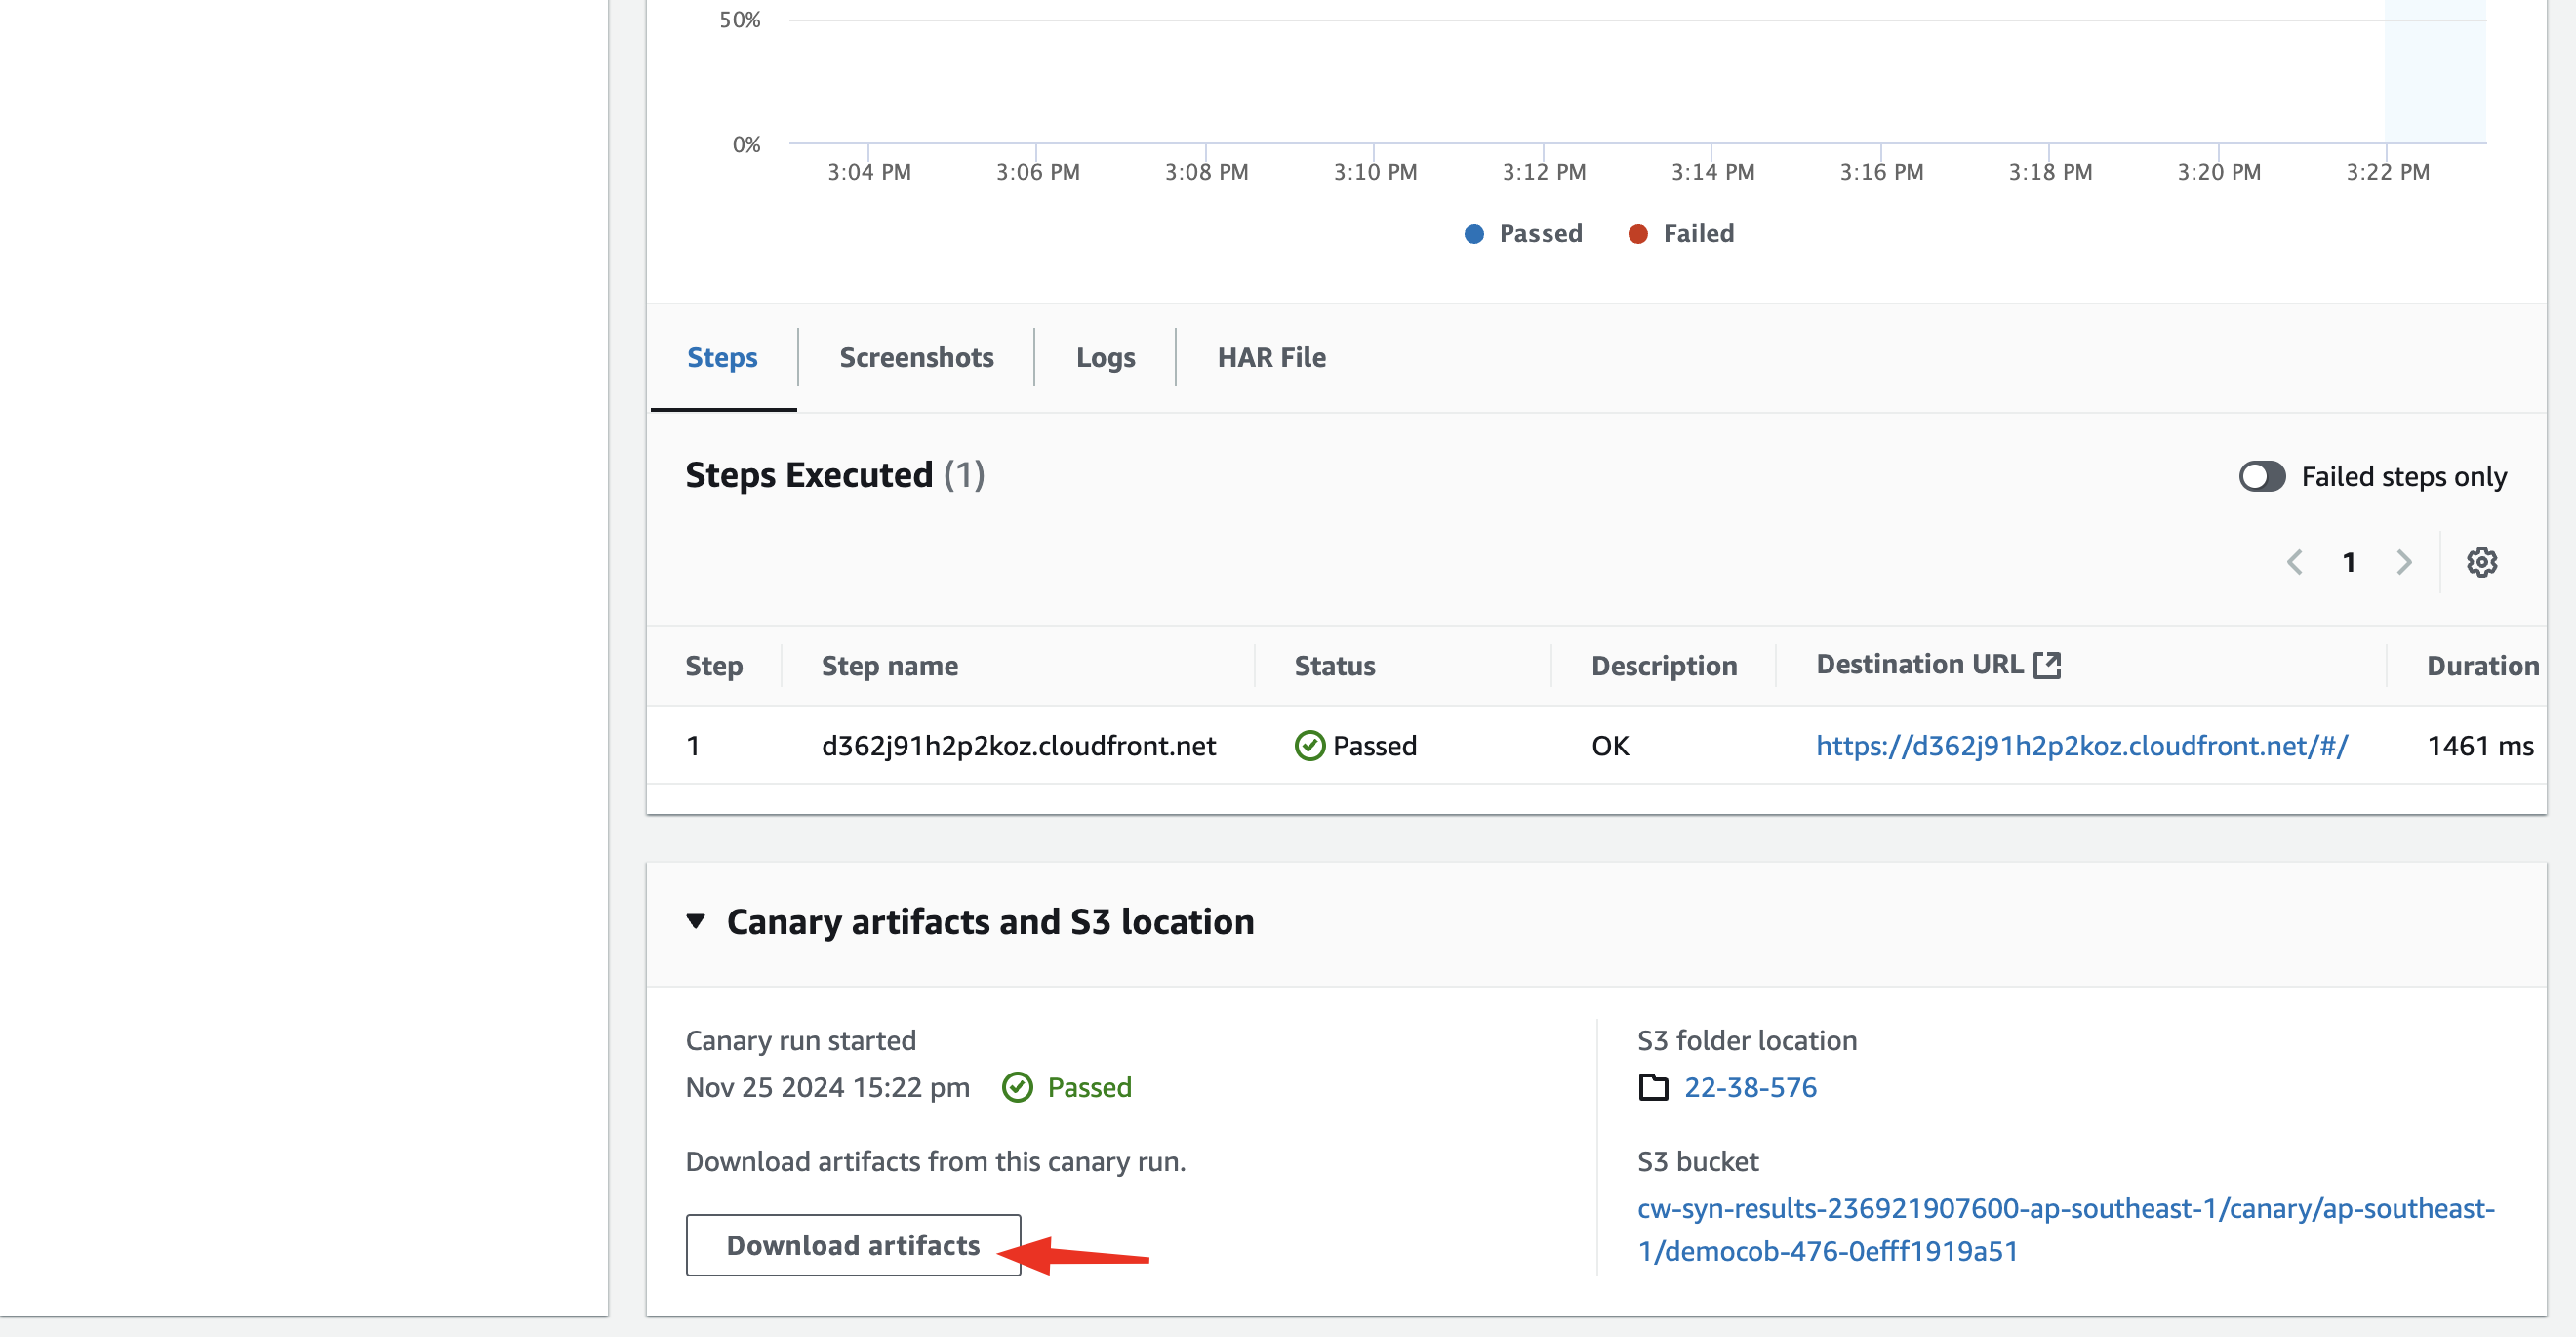
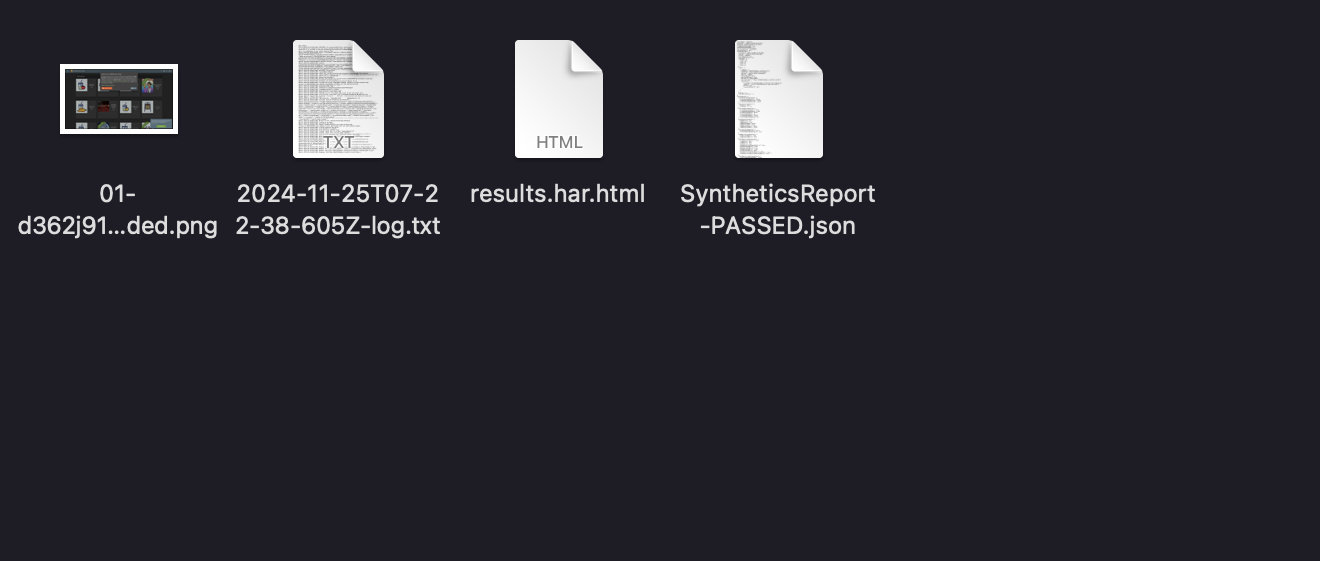
2-c. Under Canary Artifacts and S3 Location, click on Download Artiffacts. Once downloaded you will see 4 files inside.
2-d. You can view each file on the artifact such as the log files and the HAR files.
HAR, short for HTTP Archive, is a format used for tracking information between a web browser and a website. A HAR file is primarily used for identifying performance issues, such as bottlenecks and slow load times, and page rendering problems.
Congratulations on completing your first synthetic monitoring!
Please complete the JSON file below:
{
"S3 Canary Data URL" : ""
}
After completing the JSON file, kindly delete all resources used:
- CloudWatch Canary