Experimental This feature is experimental and might change or be removed in the future. We've released it as an experimental feature to provide a preview of functionality we're working on.
We're very much looking for input and feedback on this feature. You can either contact us directly, file an issue, or tweet at us.
Executors provide a sandbox that can run resource-intensive or untrusted tasks on behalf of the Sourcegraph instance, such as:
Our sandboxing model requires the executor binary to be run on machines capable of running Linux KVM extensions. This requires bare-metal machines or machines capable of nested virtualization, which is made available by most popular Cloud providers.
Executors operate outside of your Sourcegraph instance and must be run separately from your Sourcegraph server deployment method.
Since they must still be able to reach the Sourcegraph instance in order to dequeue and perform work, requests between the Sourcegraph instance and the executors are authenticated via a shared secret.
That means, in order to deploy executors that can talk to the Sourcegraph instance, you need to do the following:
- Confirm executors can reach Sourcegraph instance
- Optional: Configuring auto scaling
- Optional: Configuring observability
Before starting any executors, generate an arbitrary secret string (with at least 20 characters) and set it as the executors.accessToken key in your Sourcegraph instance's site-config.
Once the access token is set, executors can use that access token to talk to the Sourcegraph instance.
There are two ways to install and run executors:
- Using our Terraform modules to provision machines on Google Cloud or AWS that run executors
- Downloading and running executor binaries yourself
We supply Terraform modules to provision machines running executors on common cloud providers (Google Cloud or AWS).
A Terraform definition of executor compute resources will look similar to the following basic, minimal usage. Here, we configure the use of a Terraform module defined in the public registry - no explicit installation or clone step is required to use the modules provided by Sourcegraph.
module "executors" {
  source  = "sourcegraph/executors/<cloud>"
  version = "<version>"

  executor_sourcegraph_external_url            = "<sourcegraph_external_url>"
  executor_sourcegraph_executor_proxy_password = "<shared_secret_configured_in_sourcegraph_instance>"
  executor_queue_name                          = "codeintel" # Type of work (e.g., codeintel, batches)
  executor_instance_tag                        = "codeintel"
  executor_metrics_environment_label           = "prod"
  docker_mirror_static_ip                      = "10.0.1.4"
}
Two variables must be supplied to the module in order for it to contact your Sourcegraph instance:
sourcegraph_external_url(Google; AWS): The public URL of your Sourcegraph instance. This corresponds to theexternalURLvalue in your Sourcegraph instance's site-config and must be resolvable from the provisioned executor compute resources.sourcegraph_executor_proxy_password(Google; AWS): The access token chosen and configured above.
Additional values may need to be supplied for a specific cloud provider. Refer to the relevant Terraform module documentation for specifics.
To deploy executor compute resources defined in the Terraform file above, simply run terraform apply.
See the Examples for more information on how to configure and deploy single or multiple executors.
You can also download and run the executor binaries yourself, without using Terraform.
The following dependencies need to be available on the machine on which you want to run the executor binary:
- Docker
- git >= v2.18
- Ignite v0.10.0
- CNI Plugins v0.9.1
You can also take a look at what goes into our executor machine images, used by our Terraform modules, to see how we run executor binaries.
Once dependencies are met, you can download and run executor binaries:
Step 1: Confirm that virtualization is enabled
The following command checks whether virtualization is enabled on the machine, which is required for our sandboxing model.
If it prints something other than 0, virtualization is enabled.
grep -cw vmx /proc/cpuinfoStep 2: Download latest binary
Below are the download links for the insiders release (latest) of executors:
Download and setup executor binary:
curl -sfLo executor https://storage.googleapis.com/sourcegraph-artifacts/executor/latest/linux-amd64/executor
chmod +x executor
mv executor /usr/local/bin
Step 3: Generate Ignite base image
This creates the base image that Ignite will use when creating new Firecracker microVMs for each job.
# Change this to use the version of src-cli that's compatible with your Sourcegraph instance.
# See this for details: https://github.com/sourcegraph/src-cli#version-compatible-with-your-sourcegraph-instance
export SRC_CLI_VERSION="3.34.1"
export EXECUTOR_FIRECRACKER_IMAGE="sourcegraph/ignite-ubuntu:insiders"

# Download Dockerfile and build Docker image
mkdir -p /tmp/ignite-ubuntu
curl -sfLo /tmp/ignite-ubuntu/Dockerfile https://raw.githubusercontent.com/sourcegraph/sourcegraph/main/enterprise/cmd/executor/image/ignite-ubuntu/Dockerfile
docker build -t "${EXECUTOR_FIRECRACKER_IMAGE}" --build-arg SRC_CLI_VERSION="${SRC_CLI_VERSION}" /tmp/ignite-ubuntu

# Import Docker image into Ignite
ignite image import --runtime docker "${EXECUTOR_FIRECRACKER_IMAGE}"

# Clean up
docker image rm "${EXECUTOR_FIRECRACKER_IMAGE}"
Step 4: Optional: Pre-heat Ignite by importing kernel image
This step imports the kernel image to avoid the executor having to import it when executing the first job.
# Change this to match the version of Ignite you're using.
export IGNITE_VERSION=v0.10.0
export KERNEL_IMAGE="weaveworks/ignite-kernel:5.10.51"

ignite kernel import --runtime docker "${KERNEL_IMAGE}"
docker pull "weaveworks/ignite:${IGNITE_VERSION}"
Step 5: Setup required environment variables
| Env var | Example value | Description |
|---|---|---|
EXECUTOR_FRONTEND_URL |
http://sourcegraph.example.com |
The external URL of the Sourcegraph instance. |
EXECUTOR_FRONTEND_PASSWORD |
our-shared-secret |
The shared secret configured in the Sourcegraph instannce under executors.accessToken |
EXECUTOR_QUEUE_NAME |
batches |
The name of the queue to pull jobs from to. Possible values: batches and codeintel |
# Example:
export EXECUTOR_QUEUE_NAME=batches
export EXECUTOR_FRONTEND_URL=http://sourcegraph.example.com
export EXECUTOR_FRONTEND_PASSWORD=hunter2hunter2hunter2
Step 6: Start executor
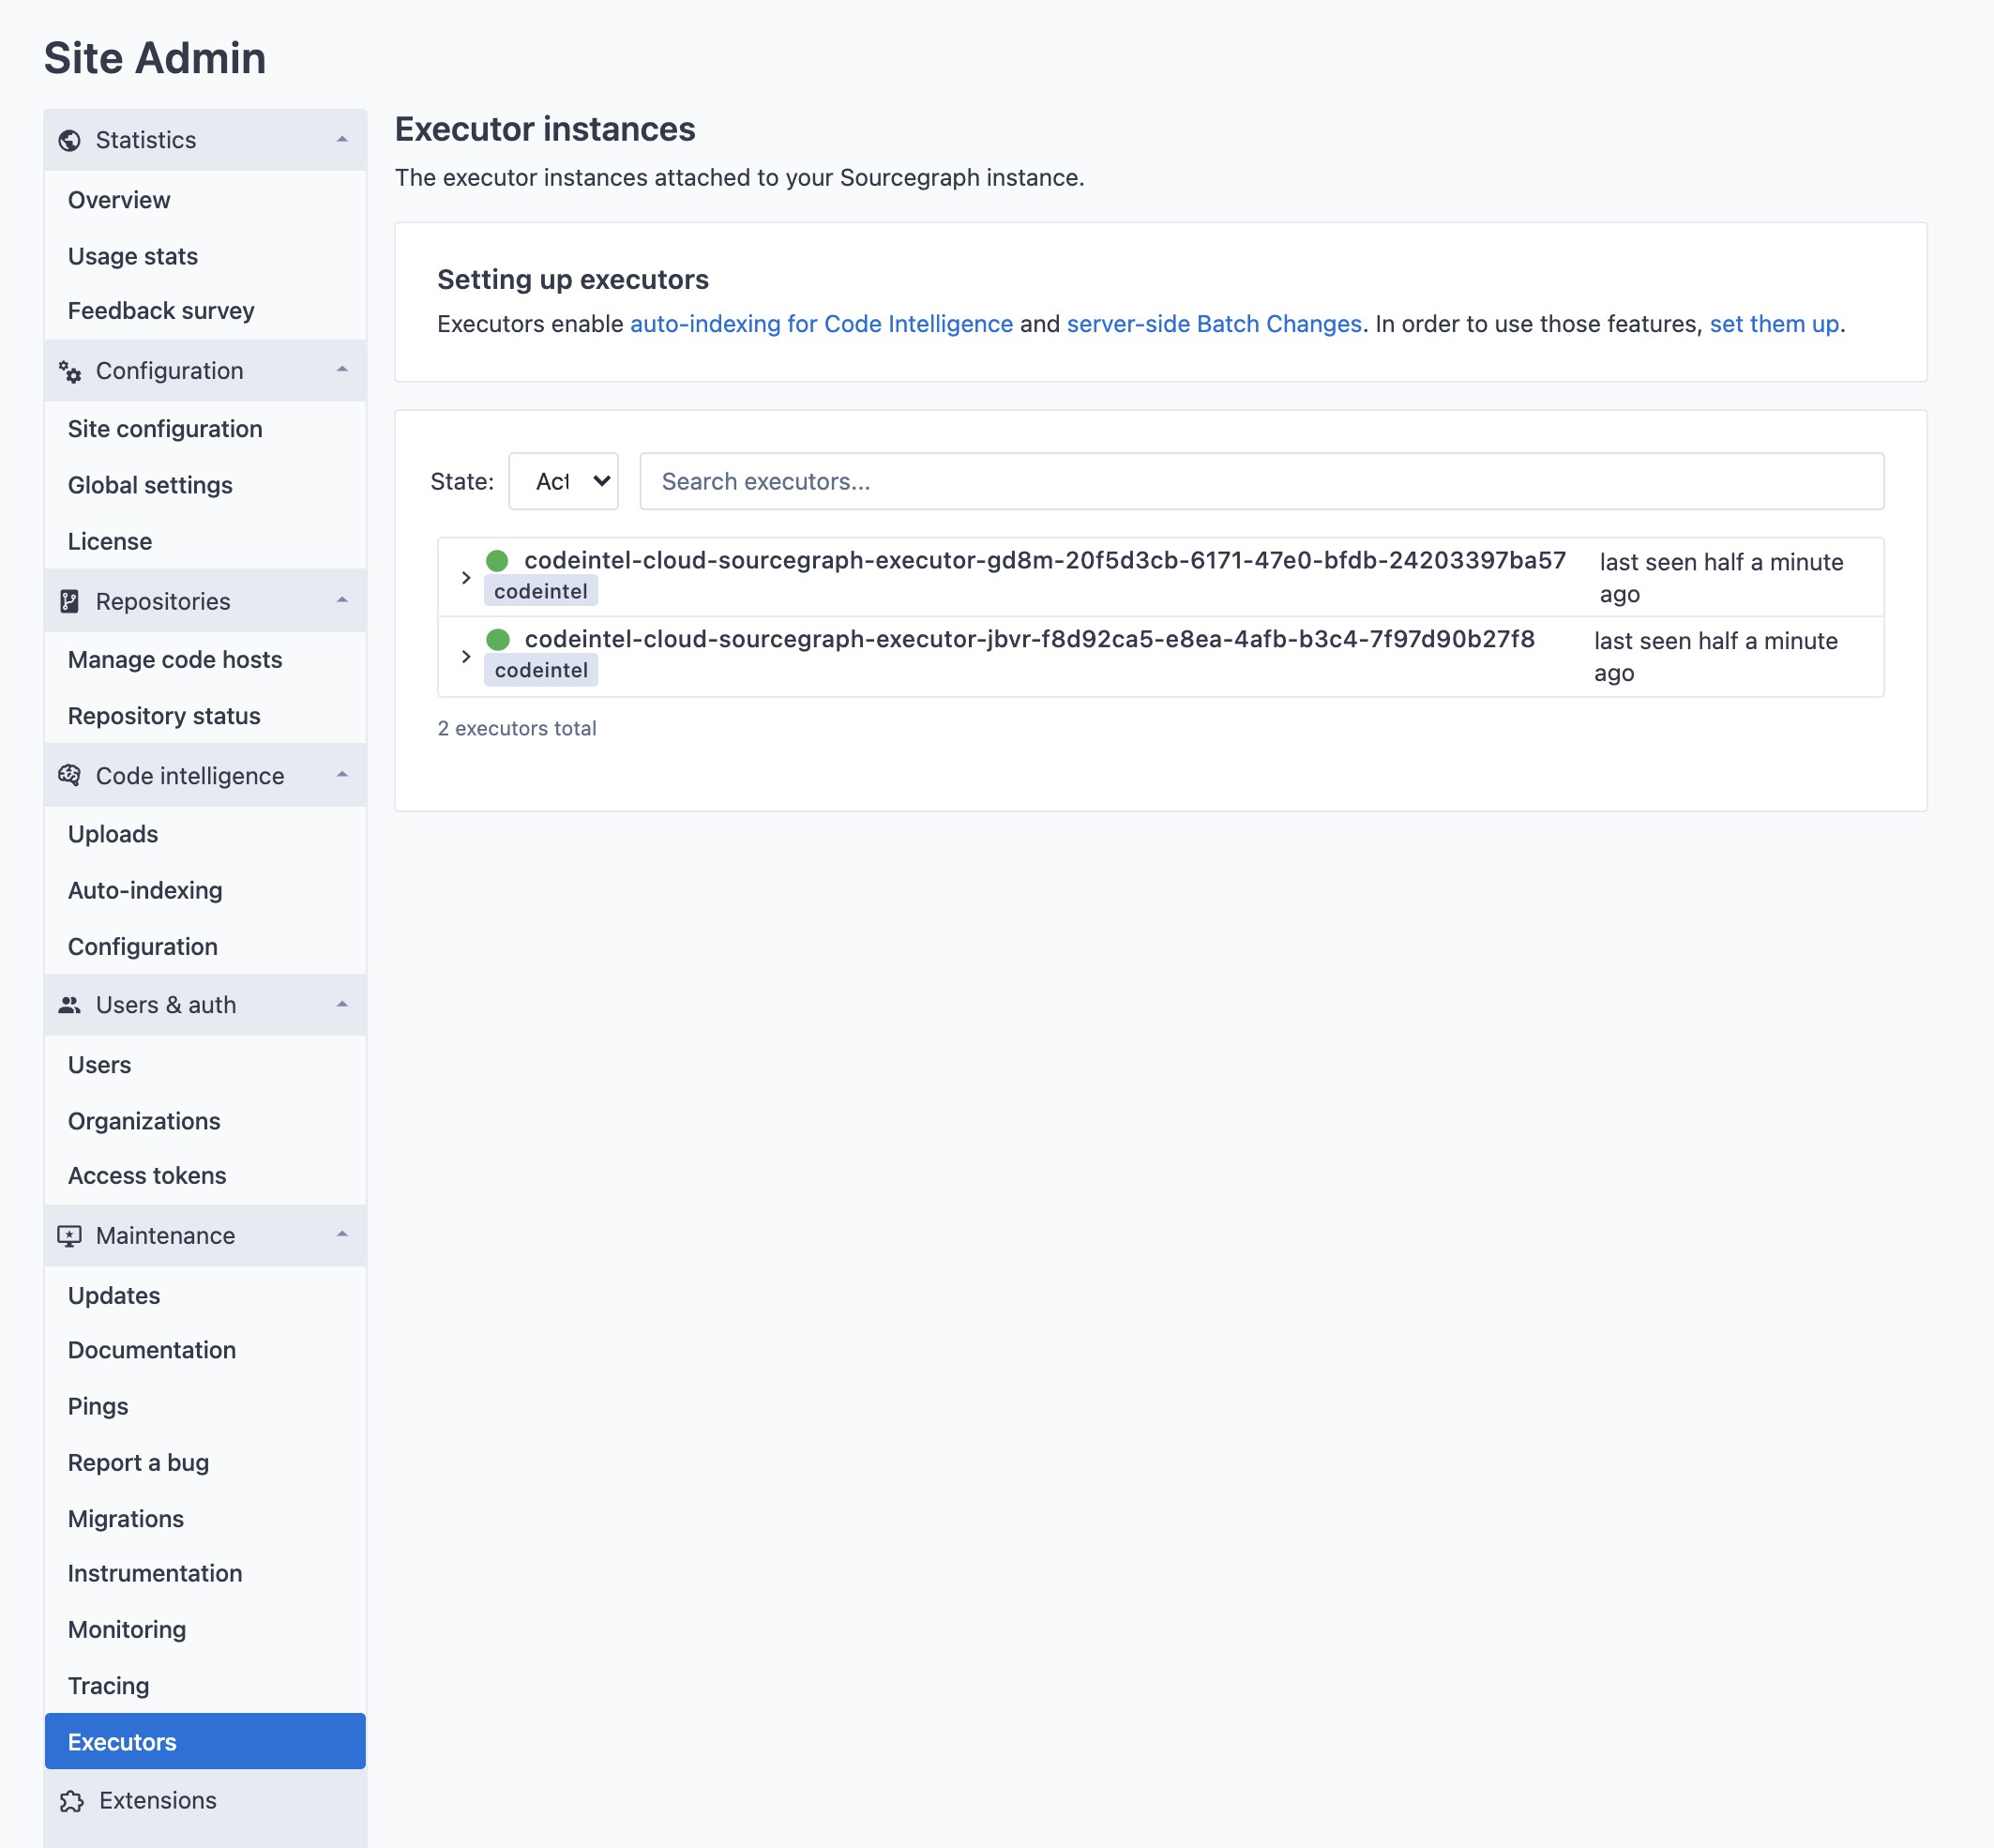
/usr/local/bin/executorIf executor instances boot correctly and can authenticate with the Sourcegraph frontend, they will show up in the Executors page under Site Admin > Maintenance.
The following are complete examples of provisioning a single executor type using each of the provided Terraform modules. In these examples, executors pull from the queue codeintel, which controls auto-indexing.
The following are complete examples of provisioning multiple executor types using the provided Terraform submodules. In these examples, two pools of executors pull from the codeintel and batches queues, which control auto-indexing and server-side batch changes, respectively.
Let's walk through setting up a single executor VM on GCP and indexing a repository.
- Install Terraform
0.13.7(must match the version listed in.tool-versions):
brew install tfenv
tfenv install 0.13.7
tfenv use 0.13.7
- Install
gcloud - Run
gcloud auth application-default login - Open your Sourcegraph instance in your browser, click your profile in the top right, click Site admin, expand Configuration, click Site configuration, and set:
"externalURL": "<URL>"to a URL that is accessible from the GCP VM that will be created later (e.g. a public URL such ashttps://sourcegraph.example.com)"executors.accessToken": "<new long secret>"to a new long secret (e.g.cat /dev/random | base64 | head -c 20)"codeIntelAutoIndexing.enabled": true
- Download the example files and change these:
project: your GCP project name and changeregionandzoneif neededexecutor_sourcegraph_external_url: this must matchexternalURLyou set in your site configexecutor_sourcegraph_executor_proxy_password: this must matchexecutors.accessTokenyou set in your site config
- Run
terraform initto download the Sourcegraph executor modules - Run
terraform applyand enter "yes" to create the executor VM - Go back to the site admin page, expand Maintenance, click Executors, and check to see if your executor shows up in the list with a green dot 🟢. If it's not there:
- Make sure
terraform applyexited with code 0 and did not print any errors - Make sure a GCP VM was created:
$ gcloud compute instances list
NAME                                          ZONE           MACHINE_TYPE   PREEMPTIBLE  INTERNAL_IP  EXTERNAL_IP    STATUS
sourcegraph-executor-h0rv                     us-central1-c  n1-standard-4               10.0.1.16    ...            RUNNING
sourcegraph-executors-docker-registry-mirror  us-central1-c  n1-standard-2               10.0.1.2     ...            RUNNING
- Make sure the
executorservice is running:
you@sourcegraph-executor-h0rv:~$ systemctl status executor
🟢 executor.service - User code executor
     Loaded: loaded (/etc/systemd/system/executor.service; enabled; vendor preset: enabled)
     Active: active (running) since Thu 2021-11-18 02:28:48 UTC; 19s ago
- Make sure there are no errors in the
executorservice logs:
you@sourcegraph-executor-h0rv:~$ journalctl -u executor | less
Nov 18 02:31:01 sourcegraph-executor-h0rv executor[2465]: t=2021-11-18T02:31:01+0000 lvl=dbug msg="TRACE internal" host=... path=/.executors/queue/codeintel/dequeue code=204 duration=92.131237ms
Nov 18 02:31:01 sourcegraph-executor-h0rv executor[2465]: t=2021-11-18T02:31:01+0000 lvl=dbug msg="TRACE internal" host=... path=/.executors/queue/codeintel/canceled code=200 duration=90.630467ms
Nov 18 02:31:02 sourcegraph-executor-h0rv executor[2465]: t=2021-11-18T02:31:02+0000 lvl=dbug msg="TRACE internal" host=... path=/.executors/queue/codeintel/dequeue code=204 duration=91.269106ms
Nov 18 02:31:02 sourcegraph-executor-h0rv executor[2465]: t=2021-11-18T02:31:02+0000 lvl=dbug msg="TRACE internal" host=... path=/.executors/queue/codeintel/canceled code=200 duration=161.469685ms
- Make sure the
EXECUTOR_FRONTEND_URLandEXECUTOR_FRONTEND_PASSWORDin/etc/systemd/system/executor.envare correct - Make sure the VM can hit your
externalURL:
you@sourcegraph-executor-h0rv:~$ curl <your externalURL here>
<a href="/sign-in?returnTo=%2F">Found</a>
- Go back to the site admin page, expand Code intelligence, click Configuration, click Create new policy, and fill in:
- Name:
LSIF - Click add a repository pattern
- Repository pattern #1: set this to an existing repository on your Sourcegraph instance (e.g.
github.com/gorilla/mux) - Type:
HEAD - Auto-indexing: Enabled
- Go to that repository's page, click Code Intelligence, click Auto-indexing, and check to see if an indexing job has appeared. If nothing is there:
- Try clicking Enqueue
- Try setting a higher update frequency:
PRECISE_CODE_INTEL_AUTO_INDEXING_TASK_INTERVAL=10s - Try setting a lower delay:
PRECISE_CODE_INTEL_AUTO_INDEXING_REPOSITORY_PROCESS_DELAY=10s
- Once you have a completed indexing job, click Uploads and check to see that the LSIF dump has been uploaded.
- Once the dump has been uploaded, you should see the
PRECISEbadge in the hover popover! 🎉 - Optionally, add
.terraform,terraform.tfstate, andterraform.tfstate.backupto your.gitignore.
NOTE: Auto scaling is currently not supported when downloading and running executor binaries yourself
Auto scaling of executor instances can help to increase concurrency of jobs, without paying for unused resources. With auto scaling, you can scale down to 0 instances when no workload exist and scale up as far as you like and your cloud provider can support. Auto scaling needs to be configured separately.
Auto scaling makes use of the auto-scaling capabilities of the respective cloud provider (AutoScalingGroups on AWS and Instance Groups on GCP). Sourcegraph's worker service publishes a scaling metric (that is, the number of jobs in queue) to the cloud providers. Then, based on that reported value, the auto scalers add and remove compute resources to match the required amount of compute. The autoscaler will attempt to hold 1 instance running per each jobs_per_instance_scaling items in queue.
For example, if jobs_per_instance_scaling is set to 20 and the queue size is currently 400, then 20 instances would be determined as required to handle the load. You might want to tweak this number based on the machine type, concurrency per machine and desired processing speed.
With the Terraform variables min_replicas and max_replicas in the Terraform modules linked to above, you can configure the minimum and maximum number of compute machines to be run at a given time.
For auto scaling to work, two things must be true:
min_replicasmust be>= 0andmax_replicasmust be> min_replicas.- The Sourcegraph instance (its
workerservice, specifically) needs to publish scaling metrics to the used cloud provider.
For the latter to work, the Sourcegraph instance needs to be configured with the correct credentials that allow it to access the cloud provider.
The credentials submodule in both our AWS and GCP executor modules exists for that purpose. When used, the credentials module sets up the credentials on the cloud provider and returns them in the Terraform outputs.
Here's an example of how one would use the credentials submodule:
module "my-credentials" {
  source  = "sourcegraph/executors/<cloud>//modules/credentials"

  # Find the latest version here:
  # - https://github.com/sourcegraph/terraform-google-executors/tags
  # - https://github.com/sourcegraph/terraform-aws-executors/tags
  version = "<version>"

  region          = <region>
  resource_prefix = ""
}

# For Google:
output "metric_writer_credentials_file" {
  value = module.my-credentials.metric_writer_credentials_file
}

# For AWS:
output "metric_writer_access_key_id" {
  value = module.my-credentials.metric_writer_access_key_id
}

output "metric_writer_secret_key" {
  value = module.my-credentials.metric_writer_secret_key
}
After a terraform apply, a terraform output should yield something like this:
# For AWS:
metric_writer_access_key_id = <THE_ACCESS_KEY_TO_CONFIGURE>
metric_writer_secret_key    = <THE_SECRET_KEY_TO_CONFIGURE>

# For Google:
metric_writer_credentials_file = <THE_CREDENTIALS_FILE_CONTENT_BASE64_ENCODED>
These outputs can then be used to configure the Sourcegraph instance, which is explained in the following sections for the different cloud providers.
The GCE auto-scaling groups configured by the Sourcegraph Terraform module respond to changes in metric values written to Cloud Monitoring. The target Sourcegraph instance is expected to continuously write these values.
To write the scaling metric to Cloud Monitoring, the worker service must have defined the following environment variables:
EXECUTOR_METRIC_ENVIRONMENT_LABEL: Must use the value that was set asmetrics_environment_labelwhen provisioningexecutorsEXECUTOR_METRIC_GCP_PROJECT_ID: The GCP project ID- Option 1:
EXECUTOR_METRIC_GOOGLE_APPLICATION_CREDENTIALS_FILE_CONTENT: The base64-decoded output of themetric_writer_credentials_filefrom above. - Option 2:
EXECUTOR_METRIC_GOOGLE_APPLICATION_CREDENTIALS_FILE: Path to a file containing the base64-decodedmetric_writer_credentials_fileoutput from above.
The EC2 auto-scaling groups configured by the Sourcegraph Terraform module respond to changes in metric values written to CloudWatch. The target Sourcegraph instance is expected to continuously write these values.
To write the scaling metric to CloudWatch, the worker service must have defined the following environment variables:
EXECUTOR_METRIC_ENVIRONMENT_LABEL: Must use the same value asmetrics_environment_labelEXECUTOR_METRIC_AWS_NAMESPACE: Must be set tosourcegraph-executorEXECUTOR_METRIC_AWS_REGIONEXECUTOR_METRIC_AWS_ACCESS_KEY_IDEXECUTOR_METRIC_AWS_SECRET_ACCESS_KEY
Once these are set, and the worker service has been restarted, you should be able to find the scaling metrics in your cloud providers dashboards.
To test if the metric is correctly reported into the Cloud provider:
-
On Google Cloud, this can be found in the Metrics explorer. Select Resource type: Global and then Metric:
custom/executors/queue/size. You should see values reported here. 0 is also an indicator that it works correct. -
On AWS, this can be found in the CloudWatch metrics section. Under All metrics, select the namespace
sourcegraph-executorand then the metricenvironment, queueName. Make sure there are entries returned.
Next, you can test whether the number of executors rises and shrinks as load spikes occur. Keep in mind that auto-scaling is not a real-time operation on most cloud providers and usually takes a short moment and can have some delays between the metric going down and the desired machine count adjusting.
NOTE: Observability features are currently not supported when downloading and running executor binaries yourself
Sourcegraph ships with dashboards that can display executor metrics. We highly encourage setting this up to help make informed decisions on scaling and to make debugging easier.
In order to do that, the Prometheus instance bundled with your Sourcegraph deployment must be able to scrape the executor metrics endpoint.
That requires two things:
- Provide Prometheus with service account credentials that allow it to get a list of active compute instances from the cloud provider.
- Add additional scrape jobs to Prometheus.
To add service account credentials, you can use the credentials submodule in both our AWS and GCP executor modules.
module "credentials" {
  source  = "sourcegraph/executors/<cloud>//modules/credentials"
  version = "<version>"

  region          = <region>
  resource_prefix = ""
}

# For Google:
output "instance_scraper_credentials_file" {
  value = module.my-credentials.instance_scraper_credentials_file
}

# For AWS:
output "instance_scraper_access_key_id" {
  value = module.my-credentials.instance_scraper_access_key_id
}

output "instance_scraper_access_secret_key" {
  value = module.my-credentials.instance_scraper_access_secret_key
}
Just as with auto scaling, you use the credentials submodule to get properly configured credentials in the Terraform outputs. When applied, this will yield something like this:
# For AWS:
instance_scraper_access_key_id     = <THE_ACCESS_KEY_TO_CONFIGURE>
instance_scraper_access_secret_key = <THE_SECRET_KEY_TO_CONFIGURE>

# For Google:
instance_scraper_credentials_file = <THE_CREDENTIALS_FILE_CONTENT>
Now we can use these credentials for the different cloud providers.
Credentials need to be added to the Prometheus container of your Sourcegraph deployment and a new scrape job needs to be added.
In a Kubernetes deployment, credentials can be added by mounting the credentials file obtained from the credentials module in the last step, and pointing to it from an environment variable.
Step 1: Create a secret called prometheus-secrets containing the credentials file content:
apiVersion: v1
kind: Secret
type: Opaque
metadata:
  name: prometheus-secrets
data:
  # The Terraform output for `instance_scraper_credentials_file`
  GCP_ACCOUNT_JSON: <THE_CREDENTIALS_FILE_CONTENT>
Step 2: Modify the Prometheus deployment manifest:
containers:
- name: prometheus
  # [...]
  env:
  - name: GOOGLE_APPLICATION_CREDENTIALS
    value: /credentials/google_application_credentials.json
  volumeMounts:
  - mountPath: /credentials/google_application_credentials.json
    name: credentials
    subPath: google_application_credentials.json
    readOnly: true
volumes:
- name: credentials
  secret:
    secretName: prometheus-secrets
    items:
    - key: GCP_ACCOUNT_JSON
      path: google_application_credentials.json
Step 3: Add the following scraping job that uses GCE service discovery configuration to the Prometheus configuration. To do that, you can edit the Prometheus ConfigMap and modify the contents of the prometheus.yml file. Under scrape_configs: add the following and make sure to replace {GCP_PROJECT}, {GCP_ZONE} and {INSTANCE_TAG}. The {INSTANCE_TAG} value must be the same as instance_tag.
- job_name: 'sourcegraph-executors'
  metrics_path: /proxy
  params:
    module: [executor]
  gce_sd_configs: &executor_gce_config
    - project: {GCP_PROJECT} # Change this to the GCP project ID
      port: 9999
      zone: {GCP_ZONE} # Change this to the GCP zone
      filter: '(labels.executor_tag = {INSTANCE_TAG})' # Change {INSTANCE_TAG} to the `executor_instance_tag` set in the Terraform modules
  relabel_configs: &executor_relabel_config
    - source_labels: [__meta_gce_public_ip]
      target_label: __address__
      replacement: "${1}${2}:9999"
      separator: ''
    - source_labels: [__meta_gce_zone]
      regex: ".+/([^/]+)"
      target_label: zone
      separator: ''
    - source_labels: [__meta_gce_project]
      target_label: project
    - source_labels: [__meta_gce_instance_name]
      target_label: instance
      separator: ''
    - regex: "__meta_gce_metadata_(image_.+)"
      action: labelmap
- job_name: 'sourcegraph-executor-nodes'
  metrics_path: /proxy
  params:
    module: [node]
  gce_sd_configs: *executor_gce_config
  relabel_configs: *executor_relabel_config
# If you've also used the Terraform modules to provision Docker registry
# mirrors for executors:
- job_name: 'sourcegraph-executors-docker-registry-mirrors'
  metrics_path: /proxy
  params:
    module: [registry]
  gce_sd_configs: &gce_executor_mirror_config
    - project: {GCP_PROJECT} # Change this to the GCP project ID
      port: 9999
      zone: {GCP_ZONE} # Change this to the GCP zone
      filter: '(labels.executor_tag = {INSTANCE_TAG}-docker-mirror)' # Change {INSTANCE_TAG} to the `executor_instance_tag` set in the Terraform modules
  relabel_configs: *executor_relabel_config
- job_name: 'sourcegraph-executors-docker-registry-mirror-nodes'
  metrics_path: /proxy
  params:
    module: [node]
  gce_sd_configs: *gce_executor_mirror_config
  relabel_configs: *executor_relabel_config
Step 4: Restart Prometheus.
If you currently have any executors or Docker registry mirrors running, you should start seeing metrics on the Executors dashboard in Grafana. Alternatively, you can check if the executors can be scraped, by port-forwarding the Prometheus UI to your local machine and checkin in the UI.
Credentials need to be added to the Prometheus container of your Sourcegraph deployment and a new scrape job needs to be added.
In a Kubernetes deployment, credentials can be added by setting the two secrets obtained from the credentials module in the last step as environment variables.
Step 1: Modify the Prometheus deployment manifest:
containers:
- name: prometheus
  # [...]
  env:
  - name: AWS_ACCESS_KEY_ID
    # The Terraform output for `instance_scraper_access_key_id`
    value: <THE_ACCESS_KEY_TO_CONFIGURE>
  - name: AWS_SECRET_ACCESS_KEY
    # The Terraform output for `instance_scraper_access_secret_key`
    value: <THE_SECRET_KEY_TO_CONFIGURE>
Step 2: Add the following scraping job that uses EC2 service discovery configuration to the Prometheus configuration. To do that, you can edit the Prometheus ConfigMap and modify the contents of the prometheus.yml file. Under scrape_configs: add the following and make sure to replace {AWS_REGION} and {INSTANCE_TAG}. The {INSTANCE_TAG} value must be the same as instance_tag.
- job_name: 'sourcegraph-executors'
  metrics_path: /proxy
  params:
    module: [executor]
  ec2_sd_configs: &executor_ec2_config
    - region: {AWS_REGION} # Change this to the AWS region
      port: 9999
      filters:
        - name: tag:executor_tag
          values: [{INSTANCE_TAG}] # Change {INSTANCE_TAG} to the `executor_instance_tag` set in the Terraform modules
  relabel_configs: &executor_relabel_config
    - source_labels: [__meta_ec2_public_ip]
      target_label: __address__
      replacement: "${1}${2}:9999"
      separator: ''
    - source_labels: [__meta_ec2_availability_zone]
      regex: ".+/([^/]+)"
      target_label: zone
      separator: ''
    - source_labels: [__meta_ec2_instance_id]
      target_label: instance
      separator: ''
    - source_labels: [__meta_ec2_ami]
      target_label: version
- job_name: 'sourcegraph-executor-nodes'
  metrics_path: /proxy
  params:
    module: [node]
  ec2_sd_configs: *executor_ec2_config
  relabel_configs: *executor_relabel_config
# If you've also used the Terraform modules to provision Docker registry
# mirrors for executors:
- job_name: 'sourcegraph-executors-docker-registry-mirrors'
  metrics_path: /proxy
  params:
    module: [registry]
  ec2_sd_configs: &ec2_executor_mirror_config
    - region: {AWS_REGION}
      port: 9999
      filters:
        - name: tag:executor_tag
          values: [{INSTANCE_TAG}-docker-mirror]
  relabel_configs: *executor_relabel_config
- job_name: 'sourcegraph-executors-docker-registry-mirror-nodes'
  metrics_path: /proxy
  params:
    module: [node]
  ec2_sd_configs: *ec2_executor_mirror_config
  relabel_configs: *executor_relabel_config
Step 3: Restart Prometheus.
If you currently have any executors or Docker registry mirrors running, you should start seeing metrics on the Executors dashboard in Grafana. Alternatively, you can check if the executors can be scraped, by port-forwarding the Prometheus UI to your local machine and checkin in the UI.