This guide provides comprehensive documentation for developers who want to build extensions that integrate with the VSCode Trace Extension using its external API. For adding a new view type (full-stack) see guide Develop a new view type instead.
- VSCode Trace Extension - Developer Guide
VSCode Trace Extension provides an external API that adopter extensions can rely on for communication. The API includes the following methods:
getActiveExperiment(): Experiment | undefined;
getActiveWebviewPanels(): { [key: string]: TraceViewerPanel | undefined; };
getActiveWebviews(): vscode.WebviewView[];
onWebviewCreated(listener: (data: vscode.WebviewView) => void): void;
onWebviewPanelCreated(listener: (data: vscode.WebviewPanel) => void): void;
addTraceServerContributor(contributor: TraceServerContributor): void;
setHandleTraceResourceType(handleFiles: boolean, handleFolders: boolean): void;
onSignalManagerSignal(event: K extends SignalType, listener: (...args: [...SignalArgs<Signals[K]>]) => void | Promise<void>): void;
offSignalManagerSignal(event: K extends SignalType, listener: (...args: [...SignalArgs<Signals[K]>]) => void | Promise<void>): void;getActiveExperiment(): Experiment | undefined
- Returns the currently active experiment (trace) in the Trace Viewer
- Returns
undefinedif no experiment is currently active - Useful for getting information about the currently opened trace
getActiveWebviews(): vscode.WebviewView[]
- Returns an array of all currently active webview views
- Useful for handling webviews that were created before your extension was activated
- Each webview can receive messages via
webview.webview.onDidReceiveMessage()
getActiveWebviewPanels(): { [key: string]: TraceViewerPanel | undefined; }
- Returns a dictionary of active webview panels indexed by key
- Useful for accessing existing trace viewer panels
- Each panel can receive messages via
panel.webview.onDidReceiveMessage()
onWebviewCreated(listener: (data: vscode.WebviewView) => void): void
- Registers a listener for when new webview views are created
- The listener receives the newly created webview as a parameter
- Register during extension activation to handle all new webviews
onWebviewPanelCreated(listener: (data: vscode.WebviewPanel) => void): void
- Registers a listener for when new webview panels are created
- The listener receives the newly created panel as a parameter
- Register during extension activation to handle all new panels
onSignalManagerSignal(event: K extends SignalType, listener: (...args: [...SignalArgs<Signals[K]>]) => void | Promise<void>): void
- Adds a listener for specific signal events within the extension
- Available signal types include:
'EXPERIMENT_OPENED'- Fired when a trace experiment is opened'EXPERIMENT_DELETED'- Fired when a trace experiment is deleted'EXPERIMENT_SELECTED'- Fired when a trace experiment is selected'SELECTION_RANGE_UPDATED'- Fired when a time selection changed- Other signal types as defined in the extension
- Listeners can be synchronous or asynchronous functions
offSignalManagerSignal(event: K extends SignalType, listener: (...args: [...SignalArgs<Signals[K]>]) => void | Promise<void>): void
- Removes a previously registered signal listener
- Must pass the exact same listener function that was registered
- Use this to clean up listeners when your extension is deactivated
Note: Only a subset of signals are forwarded to the extension. Here is the list of signals:
- EXPERIMENT_OPENDED
- EXPERIMENT_SELECTED
- EXPERIMENT_DELETED
- EXPERIMENT_UPDATED
- ITEM_PROPERTIES_UPDATED
- SELECTION_RANGE_UPDATED
- VIEW_RANGE_UPDATED
- TRACEVIEWERTAB_ACTIVATED
Register custom menu items in timegraph views and handle their selection. To register a menu the vscode message contributeContextMenu has to be sent with payload ContextMenuContributedSignalPayload to the trace viewer panel instance when the corresponding time graph output is added.
export interface MenuItem { id: string; label: string; // Parent Menu that this item belongs to - undefined indicates root menu item parentMenuId?: string; }
export class ContextMenuContributedSignalPayload {
    private outputDescriptorId: string;
    private menuItems: ContextMenuItems;
}

export interface SubMenu {
    id: string;
    label: string;
    items: MenuItem[];
    submenu: SubMenu | undefined;
}

export interface ContextMenuItems {
    submenus: SubMenu[];
    items: MenuItem[];
}- When the menu item is clicked, a
'contextMenuItemClicked'signal is emitted with the menuId, data provider ID and the properties of the selection (entry ID and parent entry ID).
addTraceServerContributor(contributor: TraceServerContributor): void
- Adds a custom contributor to the trace server lifecycle
- The contributor object must implement:
startServer(): Promise<void>- Called when server should startstopServer(): Promise<void>- Called when server should stopisApplicable(pathToTrace: string): boolean- Determines if contributor applies to a trace
- Useful for adding custom server startup/shutdown logic
setHandleTraceResourceType(handleFiles: boolean, handleFolders: boolean): void
- Configures which types of trace resources the extension should handle
handleFiles- Whether to handle individual trace fileshandleFolders- Whether to handle trace folders/directories- Allows adopter extensions to customize trace resource handling behavior
First, retrieve the API object from the vscode-trace-extension:
const ext = vscode.extensions.getExtension("eclipse-cdt.vscode-trace-extension");
const importedApi = ext.exports;const experiment = importedApi.getActiveExperiment();
if (experiment) {
console.log(`Active experiment: ${experiment.name}`);
}Handle existing webviews that were created before your extension was activated:
Note: The command key was changed from message.command to message.method after version 0.4.0.
for (const webview of importedApi.getActiveWebviews()) {
    webview.webview.onDidReceiveMessage((message) => {
        switch (message.method) {
            case "webviewReady":
                console.log("From adopter extension - webviewReady signal received");
                break;
            default:
                break;
        }
    });
}Register listeners during extension activation to handle newly created webview panels:
importedApi.onWebviewPanelCreated(_panel => {
    // For newly created panel, handle messages from webviews
    _panel.webview.onDidReceiveMessage((message) => {
        switch (message.method) {
            case "webviewReady":
                console.log("From adopter extension - webviewReady signal received");
                break;
            default:
                break;
        }
    });
    _panel.onDidDispose(() => {
        console.log("panel disposed");
    });
});
Note: For other webview types similar use importedAPI.onWebviewCreated instead;
Add and remove listeners for extension signals:
const _onExperimentOpened = (experiment: Experiment): void => {
    console.log(experiment.UUID);
};

// Add a listener
importedApi.onSignalManagerSignal('EXPERIMENT_OPENED', _onExperimentOpened);

// Remove a listener
importedApi.offSignalManagerSignal('EXPERIMENT_OPENED', _onExperimentOpened);
Each existing webview will use a set of messages which an adopter extension can hook into. The list of supported messages per webview are defined in the corresponding webview provider or panel source code implmentations.
Register custom menu items in timegraph views and handle their selection. To register a menu the vscode message contributeContextMenu has to be sent to the trace viewer panel instance when the corresponding time graph output is added. Right now there is no dedicated message or signal that can be used to trigger the contribution signal. However, when a row is selected in the timegraph, selection is propagated to the corresponding webview panel using vscode message rowSelectionsChanged. For that add a new switch case to the _panel.webview.onDidReceiveMessage handler as described in Listening for New Webviews and execute contribution code as shown in example function setupTimeGraphMenu below.
    // ... existing code ...
    case 'rowSelectionsChanged':
        outputChannel.appendLine('Panel: row selections changed');
        // Setup time graph menu

        setupTimeGraphMenu(panel, message);
        break;

    // ... more of existing code

function setupTimeGraphMenu(panel: vscode.WebviewPanel, message: any): void {
   // Add custom menus. Example: Flame Graph of Trace Compass server
    const dpId = "org.eclipse.tracecompass.internal.analysis.profiling.callstack.provider.CallStackDataProvider";
    if (!message.params) {
        return;
    }
    const params = JSON.parse(message.params);
    if (params.outputDescriptorId === dpId) {
        const viewId = message.sender.webviewId;
        const item = panelRegistry[viewId];
        if (item && item.panel === panel) {
            const ctxMenu: ContextMenuItems = {
                submenus: [ {
                        label: "Submenu 1",
                        id: "submenu1.id",
                        items: [
                            { id: "SubmenuItem1", label: "Submenu Item 1" },
                        ],
                        submenu: undefined
                    }
                ],
                items: [
                    { id: "menuItem2", label: "Menu Item 2" }
                ]
            };
            const payload: ContextMenuContributedSignalPayload =
                new ContextMenuContributedSignalPayload( dpId, ctxMenu);

            /*
             * Add receiver field needed because vscode-trace-extension uses the vscode-messenger library
             * which requires the receiver field to be present in the message.
             */
            panel.webview.postMessage({
                "method": "contributeContextMenu",
                "receiver": {
                    "type": 'webview',
                    "webviewType": item.viewType,
                    "webviewId": item.viewId
                },
                "params": payload
            });
        }
    }
}
Whenever a user clicks with the right mouse button on a time graph row, the menu as declared above will show. When the user clicks on a menu item the signal contextMenuItemClicked is propagated to the trace viewer panel. For that add a new switch case to the _panel.webview.onDidReceiveMessage handler as described in Listening for New Webviews and hanle the menu selection.
    // ... existing code ...
        case 'contextMenuItemClicked':
            const params = JSON.parse(message.params);
            const info =
            Menu clicked info:
- Data Provider: ${params.outputDescriptorId}
- Menu ID: ${params.itemId}
- ParentMenuId: ${params.parentMenuId || 'N/A'}
- Props: ${JSON.stringify(params.props || '{}')}
        ;
                outputChannel.appendLine(`Panel: context menu item clicked: ${info}`);
                break;
            }
    });

// ... rest of existing code ...Add custom hooks to the trace server's start/stop lifecycle:
const contributor: TraceServerContributor = {
    startServer: async () => {
        // Perform pre-startup actions
        // Start the server
        console.log("server started");
    },
    stopServer: async () => {
        // Perform cleanup actions
        // Stop the server
        console.log("server stopped");
    },
    isApplicable: (pathToTrace: string) => {
        // Check whether this contributor applies for the trace at 'pathToTrace'
        return true;
    }
};

importedApi.addTraceServerContributor(contributor);Customize which trace resource types the extension should handle:
const handleTraceFiles = true;
const handleTraceFolders = false;

// The base extension will only provide support for trace files, not folders
importedApi.setHandleTraceResourceType(handleTraceFiles, handleTraceFolders);-
Extension Activation: Register listeners during your extension's activation to ensure you don't miss any events.
-
Webview Handling: Use both
getActiveWebviews()andonWebviewCreated()to handle existing and new webviews respectively. -
Signal Cleanup: Always remove signal listeners when your extension is deactivated to prevent memory leaks.
-
Error Handling: Wrap API calls in try-catch blocks as the trace extension might not be available or activated.
-
Version Compatibility: Check the trace extension version if using features that were added in specific versions.
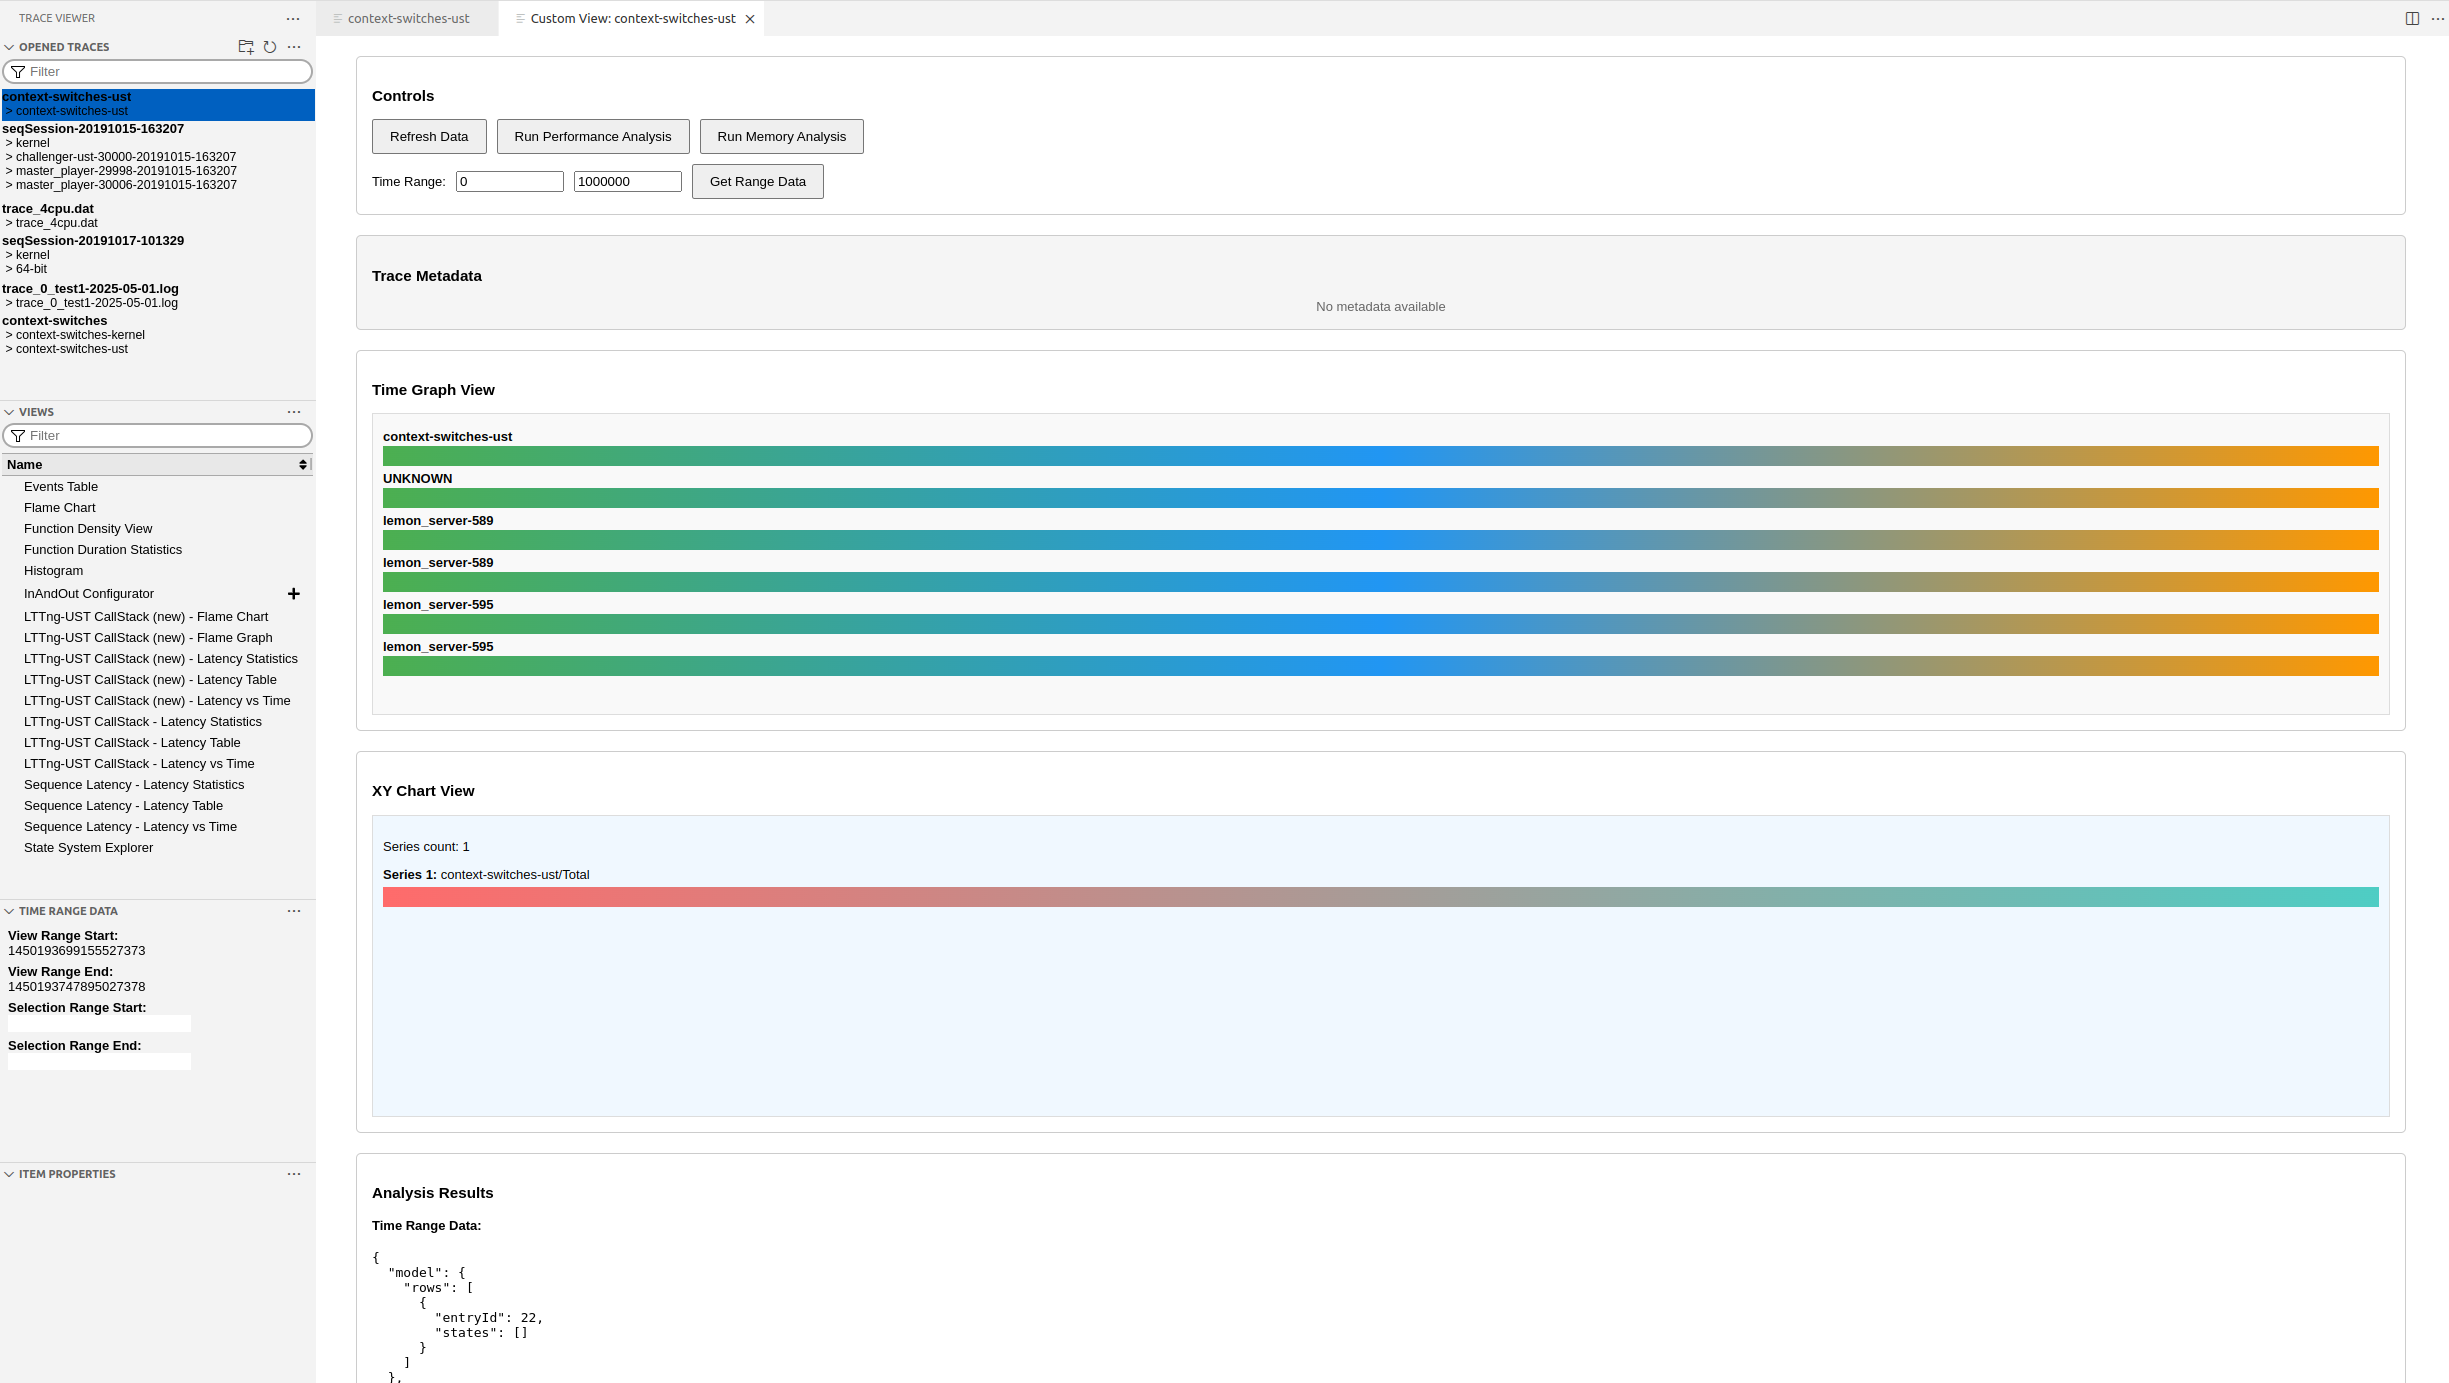
This example demonstrates how to create a VSCode extension that integrates with the vscode-trace-extension. The goal of the example is to have a command to open a custom webview with specific content, which is able to query a custom trace server endpoint. The view will look like as in the picture below.
package.json
{
    "name": "my-trace-extension",
    "displayName": "My Trace Extension",
    "description": "Example extension integrating with VSCode Trace Extension",
    "version": "0.0.1",
    "engines": {
        "vscode": "^1.74.0"
    },
    "categories": ["Other"],
    "activationEvents": [
        "onExtension:eclipse-cdt.vscode-trace-extension"
    ],
    "main": "./out/extension.js",
    "contributes": {
        "commands": [
            {
                "command": "myTraceExtension.showActiveTrace",
                "title": "Show Active Trace Info"
            }
        ]
    },
    "extensionDependencies": [
        "eclipse-cdt.vscode-trace-extension"
    ],
    "scripts": {
        "compile": "tsc -p ./",
        "watch": "tsc -watch -p ./"
    },
    "devDependencies": {
        "@types/vscode": "^1.74.0",
        "typescript": "^4.9.4"
    }
    "dependencies": {
        "traceviewer-base": "^0.9.1",
        "vscode-messenger": "^0.5.0"
    }
}
src/extension.ts
import * as vscode from 'vscode';
import { signalManager } from 'traceviewer-base/lib/signals/signal-manager';
import { ContextMenuContributedSignalPayload, ContextMenuItems } from 'traceviewer-base/lib/signals/context-menu-contributed-signal-payload';
import { json } from 'stream/consumers';

interface TraceExtensionAPI {
    getActiveExperiment(): any;
    getActiveWebviews(): vscode.WebviewView[];
    getActiveWebviewPanels(): { [key: string]: any };
    onWebviewCreated(listener: (data: vscode.WebviewView) => void): void;
    onWebviewPanelCreated(listener: (data: vscode.WebviewPanel) => void): void;
    onSignalManagerSignal(event: string, listener: (...args: any[]) => void): void;
    offSignalManagerSignal(event: string, listener: (...args: any[]) => void): void;
    addTraceServerContributor(contributor: any): void;
    setHandleTraceResourceType(handleFiles: boolean, handleFolders: boolean): void;
}

interface WebviewPanelItem {
    panel: vscode.WebviewPanel;
    viewId: string;
    viewType: string;
}

let traceAPI: TraceExtensionAPI | undefined;
let outputChannel: vscode.OutputChannel;
let panelRegistry: { [key: string]: WebviewPanelItem } = {};


export function activate(context: vscode.ExtensionContext) {
    outputChannel = vscode.window.createOutputChannel('My Trace Extension');
    outputChannel.appendLine('My Trace Extension activated');

    // Get the trace extension API
    const traceExtension = vscode.extensions.getExtension('eclipse-cdt.vscode-trace-extension');
    if (!traceExtension) {
        vscode.window.showErrorMessage('VSCode Trace Extension not found');
        return;
    }

    if (!traceExtension.isActive) {
        traceExtension.activate().then(() => {
            initializeTraceAPI(traceExtension.exports);
        });
    } else {
        initializeTraceAPI(traceExtension.exports);
    }

    // Register command
    const disposable = vscode.commands.registerCommand('myTraceExtension.showActiveTrace', () => {
        showActiveTraceInfo();
    });

    context.subscriptions.push(disposable, outputChannel);
}

function initializeTraceAPI(api: TraceExtensionAPI) {
    traceAPI = api;
    outputChannel.appendLine('Trace API initialized');

    // Set up signal listeners
    setupSignalListeners();

    // Set up webview listeners
    setupWebviewListeners();

    // Configure resource handling
    traceAPI.setHandleTraceResourceType(true, true);

    // Add trace server contributor
    addTraceServerContributor();
}

function setupSignalListeners() {
    if (!traceAPI) return;

    // Listen for experiment events
    const onExperimentOpened = (experiment: any) => {
        outputChannel.appendLine(`Experiment opened: ${experiment.name}`);
        vscode.window.showInformationMessage(`Trace opened: ${experiment.name}`);
    };

    const onSelcetionRange = (data: any) => {
        outputChannel.appendLine('Selection Range..............');
        outputChannel.appendLine(`Selection data: ${JSON.stringify(data)}`);
        if (data && data.experimentUUID && data.timeRange) {
            const experimentUUID = data.experimentUUID;
            const start = data.timeRange.start;
            const end = data.timeRange.end;
            outputChannel.appendLine(`Selected range - UUID: ${experimentUUID}, Start: ${start}, End: ${end}`);
        }
    };

    traceAPI.onSignalManagerSignal('EXPERIMENT_OPENED', onExperimentOpened);
    traceAPI.onSignalManagerSignal('SELECTION_RANGE_UPDATED', onSelcetionRange);
}

function setupTimeGraphMenu(panel: vscode.WebviewPanel, message: any): void {

    // Add custom menus. Example: Flame Graph of Trace Compass server
    const dpId = "org.eclipse.tracecompass.internal.analysis.profiling.callstack.provider.CallStackDataProvider";
    if (!message.params) {
        return;
    }
    const params = JSON.parse(message.params);
    if (params.outputDescriptorId === dpId) {
        const viewId = message.sender.webviewId;
        const item = panelRegistry[viewId];
        if (item && item.panel === panel) {
            const ctxMenu: ContextMenuItems = {
                submenus: [ {
                        label: "Submenu 1",
                        id: "submenu1.id",
                        items: [
                            { id: "SubmenuItem1", label: "Submenu Item 1" },
                        ],
                        submenu: undefined
                    }
                ],
                items: [
                    { id: "menuItem2", label: "Menu Item 2" }
                ]
            };
            const payload: ContextMenuContributedSignalPayload =
                new ContextMenuContributedSignalPayload( dpId, ctxMenu);

            /*
             * Add receiver field needed because vscode-trace-extension uses the vscode-messenger library
             * which requires the receiver field to be present in the message.
             * https://www.npmjs.com/package/vscode-messenger
             */
            panel.webview.postMessage({
                "method": "contributeContextMenu",
                "receiver": {
                    "type": 'webview',
                    "webviewType": item.viewType,
                    "webviewId": item.viewId
                },
                "params": payload
            });
        }
    }
}

function setupWebviewListeners() {
    if (!traceAPI) return;

    // Handle existing webviews
    const existingWebviews = traceAPI.getActiveWebviews();
    existingWebviews.forEach(webview => {
        handleWebview(webview);
    });

    // Handle existing panels
    const existingPanels = traceAPI.getActiveWebviewPanels();
    Object.values(existingPanels).forEach(panel => {
        if (panel) {
            handleWebviewPanel(panel);
        }
    });

    // Listen for new webviews
    traceAPI.onWebviewCreated((webview: vscode.WebviewView) => {
        outputChannel.appendLine('New webview created');
        handleWebview(webview);
    });

    // Listen for new panels
    traceAPI.onWebviewPanelCreated((panel: vscode.WebviewPanel) => {
        outputChannel.appendLine('New webview panel created');
        handleWebviewPanel(panel);
    });
}

function handleWebview(webview: vscode.WebviewView) {
    webview.webview.onDidReceiveMessage((message) => {
        outputChannel.appendLine(`Webview message: ${JSON.stringify(message)}`);
        outputChannel.appendLine(`Webview title: ${webview.title}`);
        switch (message.method) {
            case 'webviewReady':
                outputChannel.appendLine('Webview is ready');
                break;
        }
    });
}

function handleWebviewPanel(panel: vscode.WebviewPanel) {
    panel.webview.onDidReceiveMessage((message) => {
        outputChannel.appendLine(`Panel message: ${JSON.stringify(message)}`);
        outputChannel.appendLine(`Panel title: ${panel.title} : viewType: ${panel.viewType}` );
        switch (message.method) {
            case 'webviewReady':
                outputChannel.appendLine('Panel webview is ready');
                const viewId = message.sender.webviewId;
                registerPanel(panel, viewId);
                break;
            case 'rowSelectionsChanged':
                outputChannel.appendLine('Panel: row selections changed');

                // Setup time graph menu
                setupTimeGraphMenu(panel, message);
               break;
            case 'contextMenuItemClicked':
                const params = JSON.parse(message.params);
                const info = `
Menu clicked info:
- Data Provider: ${params.outputDescriptorId}
- Menu ID: ${params.itemId}
- ParentMenuId: ${params.parentMenuId || 'N/A'}
- Props: ${JSON.stringify(params.props || '{}')}
        `;
                outputChannel.appendLine(`Panel: context menu item clicked: ${info}`);
                break;
            }
    });

    panel.onDidDispose(() => {
        outputChannel.appendLine('Panel disposed');
        deregisterPanel(panel);
    });
}

function registerPanel(panel: vscode.WebviewPanel, messengerViewId: string) {
    const item: WebviewPanelItem = {
        "panel": panel,
        "viewId": messengerViewId,
        "viewType": panel.viewType
    };
    panelRegistry[messengerViewId] = item;
}

function deregisterPanel(panel: vscode.WebviewPanel) {
    // clean-up panelRegistry
    for (let key in panelRegistry) {
        if (panelRegistry[key].panel === panel) {
            delete panelRegistry[key];
            break;
        }
    }
}

function addTraceServerContributor() {
    if (!traceAPI) return;

    const contributor = {
        startServer: async () => {
            outputChannel.appendLine('Custom server startup logic');
            // Add custom startup logic here
        },
        stopServer: async () => {
            outputChannel.appendLine('Custom server shutdown logic');
            // Add custom shutdown logic here
        },
        isApplicable: (pathToTrace: string) => {
            // Check if this contributor should handle this trace
            outputChannel.appendLine(`Checking applicability for: ${pathToTrace}`);
            return pathToTrace.endsWith('.custom');
        }
    };

    traceAPI.addTraceServerContributor(contributor);
}

function showActiveTraceInfo() {
    if (!traceAPI) {
        vscode.window.showErrorMessage('Trace API not available');
        return;
    }

    const activeExperiment = traceAPI.getActiveExperiment();
    if (activeExperiment) {
        const info = `
Active Trace Information:
- Name: ${activeExperiment.name}
- UUID: ${activeExperiment.UUID}
- Path: ${activeExperiment.traces?.[0]?.path || 'N/A'}
- Number of traces: ${activeExperiment.traces?.length || 0}
        `;
        vscode.window.showInformationMessage(info);
        outputChannel.appendLine(info);
    } else {
        vscode.window.showInformationMessage('No active trace');
    }
}

function runCustomAnalysis() {
    if (!traceAPI) return;

    const activeExperiment = traceAPI.getActiveExperiment();
    if (!activeExperiment) {
        vscode.window.showWarningMessage('No active trace for analysis');
        return;
    }

    // Simulate custom analysis
    vscode.window.withProgress({
        location: vscode.ProgressLocation.Notification,
        title: 'Running Custom Analysis',
        cancellable: false
    }, async (progress) => {
        progress.report({ increment: 0, message: 'Analyzing trace data...' });

        // Simulate analysis work
        await new Promise(resolve => setTimeout(resolve, 2000));
        progress.report({ increment: 50, message: 'Processing results...' });

        await new Promise(resolve => setTimeout(resolve, 1000));
        progress.report({ increment: 100, message: 'Complete!' });

        vscode.window.showInformationMessage('Custom analysis completed!');
        outputChannel.appendLine(`Analysis completed for: ${activeExperiment.name}`);
    });
}

export function deactivate() {
    if (traceAPI) {
        // Clean up signal listeners if needed
        outputChannel.appendLine('Extension deactivated');
    }
}
tsconfig.json
{
    "compilerOptions": {
        "module": "commonjs",
        "target": "ES2020",
        "outDir": "out",
        "lib": ["ES2020"],
        "sourceMap": true,
        "rootDir": "src",
        "strict": true
    },
    "exclude": ["node_modules", ".vscode-test"]
}- Extension Dependencies: Declare
eclipse-cdt.vscode-trace-extensionas a dependency - Activation Events: Use
onExtension:eclipse-cdt.vscode-trace-extensionto activate when the trace extension loads - API Access: Get the API through
vscode.extensions.getExtension().exports - Signal Handling: Listen for trace events and custom menu interactions
- Webview Integration: Handle both existing and new webviews/panels
- Server Contribution: Add custom logic to trace server lifecycle
- Resource Configuration: Customize which trace types to handle
This example demonstrates a complete integration that:
- Shows active trace information via a command
- Adds a custom menu item to timegraph views
- Handles trace lifecycle events
- Processes webview messages
- Contributes to trace server operations
- Provides custom analysis functionality
When your extension needs to call custom TSP (Trace Server Protocol) endpoints not available in the standard tsp-typescript-client, you can extend the client with additional methods.
Installing Dependencies
{
    "dependencies": {
        "tsp-typescript-client": "^0.8.0"
    }
}
Creating Extended TSP Client
src/extended-tsp-client.ts
See below for extended HttpTspClient. Note that the trace server will need to have the additional endpoints implemented to get successful replies.
import { RestClient, HttpTspClient, TspClientResponse } from 'tsp-typescript-client';
import { createNormalizer } from 'tsp-typescript-client/lib/protocol/serialization';

export interface CustomAnalysisRequest {
    experimentUUID: string;
    analysisType: string;
    parameters?: { [key: string]: any };
}

export interface CustomAnalysisResponse {
    analysisId: string;
    status: string;
    results?: any;
}

export const CustomAnalysisResponse = createNormalizer<CustomAnalysisResponse>({
    results: undefined
});


export class ExtendedTspClient extends HttpTspClient {
    private baseUrl2: string;

    /**
     * Constructor
     * @param baseUrl Base URL of the server (ex. https://localhost:8080/tsp/api)
     */
    public constructor(baseUrl: string) {
        // TODO make baseUrl accessible
        super(baseUrl);
        this.baseUrl2 = baseUrl;
    }

    /**
     * Start custom analysis on an experiment
     */
    async startCustomAnalysis(request: CustomAnalysisRequest): Promise<TspClientResponse<CustomAnalysisResponse>> {
        const url = this.baseUrl2 + '/experiments/' + request.experimentUUID + '/analysis/custom';

        const params = {
                analysisType: request.analysisType,
                parameters: request.parameters || {}
            };
        return RestClient.post(url, params, CustomAnalysisResponse);
    }

    /**
     * Get custom analysis status
     */
    async getCustomAnalysisStatus(experimentUUID: string, analysisId: string): Promise<TspClientResponse<CustomAnalysisResponse>> {
        const url = this.baseUrl2 + '/experiments/' + experimentUUID + '/analysis/custom/' + analysisId;
        return RestClient.get(url);
    }

    /**
     * Cancel custom analysis
     */
    async cancelCustomAnalysis(experimentUUID: string, analysisId: string): Promise<TspClientResponse<void>> {
        const url = this.baseUrl2 + '/experiments/' + experimentUUID + '/analysis/custom/' + analysisId;
        return RestClient.get(url);
    }

    /**
     * Get custom trace metadata
     */
    async getCustomMetadata(experimentUUID: string): Promise<TspClientResponse<any>> {
        const url = this.baseUrl2 + '/experiments/' + experimentUUID + '/metadata/custom';
        return RestClient.get(url);
    }

    /**
     * Update experiment configuration
     */
    async updateExperimentConfig(experimentUUID: string, config: any): Promise<TspClientResponse<void>> {
        const url = this.baseUrl2 + '/experiments/' + experimentUUID + '/config';
        return RestClient.put(url, config);
    }
}
Using Extended Client in Extension
src/tsp-service.ts
import { CustomAnalysisRequest, ExtendedTspClient } from './extended-tsp-client';

export class TspService {
    public client: ExtendedTspClient; // Make client public for webview access
constructor(baseUrl: string = 'http://localhost:8080/tsp/api') {
        this.client = new ExtendedTspClient(baseUrl);
    }

    async runCustomAnalysis(experimentUUID: string, analysisType: string, parameters?: any): Promise<string | undefined> {
        try {
            const request: CustomAnalysisRequest = {
                experimentUUID,
                analysisType,
                parameters
            };

            const response = await this.client.startCustomAnalysis(request);

            if (response.isOk() && response.getModel()) {
                return response.getModel()?.analysisId;
            } else {
                console.error('Failed to start analysis:', response.getStatusMessage());
                return undefined;
            }
        } catch (error) {
            console.error('Error starting custom analysis:', error);
            return undefined;
        }
    }

    async pollAnalysisStatus(experimentUUID: string, analysisId: string): Promise<any> {
        try {
            const response = await this.client.getCustomAnalysisStatus(experimentUUID, analysisId);

            if (response.isOk()) {
                return response.getModel();
            } else {
                console.error('Failed to get analysis status:', response.getStatusMessage());
                return null;
            }
        } catch (error) {
            console.error('Error getting analysis status:', error);
            return null;
        }
    }

    async getTraceMetadata(experimentUUID: string): Promise<any> {
        try {
            const response = await this.client.getCustomMetadata(experimentUUID);

            if (response.isOk()) {
                return response.getModel();
            } else {
                console.error('Failed to get metadata:', response.getStatusMessage());
                return null;
            }
        } catch (error) {
            console.error('Error getting metadata:', error);
            return null;
        }
    }
}
Integration with Main Extension
Updated src/extension.ts
import { TspService } from './tsp-service';

let tspService: TspService;

export function activate(context: vscode.ExtensionContext) {
    // ... existing code ...

    // Initialize TSP service
    tspService = new TspService();

    if (!traceAPI || !tspService) return;

    const activeExperiment = traceAPI.getActiveExperiment();
    if (!activeExperiment) {
        vscode.window.showWarningMessage('No active trace for analysis');
        return;
    }

    try {
        // Start custom analysis using extended TSP client
        const analysisId = await tspService.runCustomAnalysis(
            activeExperiment.UUID,
            'performance-analysis',
            { threshold: 100, includeDetails: true }
        );

        if (!analysisId) {
            vscode.window.showErrorMessage('Failed to start analysis');
            return;
        }

        // Poll for results
        vscode.window.withProgress({
            location: vscode.ProgressLocation.Notification,
            title: 'Running Custom TSP Analysis',
            cancellable: true
        }, async (progress, token) => {
            let completed = false;
            let attempts = 0;
            const maxAttempts = 30;

            while (!completed && attempts < maxAttempts && !token.isCancellationRequested) {
                const status = await tspService.pollAnalysisStatus(activeExperiment.UUID, analysisId);

                if (status) {
                    progress.report({
                        increment: (attempts / maxAttempts) * 100,
                        message: `Status: ${status.status}`
                    });

                    if (status.status === 'COMPLETED') {
                        completed = true;
                        vscode.window.showInformationMessage('Custom TSP analysis completed!');
                        outputChannel.appendLine(`Analysis results: ${JSON.stringify(status.results)}`);
                    } else if (status.status === 'FAILED') {
                        vscode.window.showErrorMessage('Analysis failed');
                        break;
                    }
                }

                if (!completed) {
                    await new Promise(resolve => setTimeout(resolve, 1000));
                    attempts++;
                }
            }

            if (!completed && !token.isCancellationRequested) {
                vscode.window.showWarningMessage('Analysis timed out');
            }
        });

    } catch (error) {
        vscode.window.showErrorMessage(`Analysis error: ${error}`);
        outputChannel.appendLine(`Analysis error: ${error}`);
    }
    // ... rest of activation code ...
}
Key Points for TSP Extension:
- Extend TspClient: Create a class that extends the base TspClient with your custom methods
- HTTP Requests: Use HttpRequest class for making calls to custom endpoints
- Response Handling: Use GenericResponse for type-safe response handling
- Error Management: Implement proper error handling for network calls
- Async Operations: Handle long-running operations with progress indication
- Service Layer: Create a service class to encapsulate TSP operations
- Integration: Use the extended client within your extension's analysis functions
This approach allows you to:
- Add custom analysis endpoints
- Extend trace metadata retrieval
- Implement custom configuration updates
- Handle asynchronous operations with proper user feedback
- Maintain type safety with TypeScript interfaces
This example shows how to create a custom webview that queries TSP data and visualizes it using the vscode-messenger library for communication. The messenger library will communicate between extension and webview. Note that the instance of custom extension doesn't share the same messenger library instance and hence can't be used to communicate to the vscode-trace-extension. This is a future enhancement of the Trace Viewer API to return the messenger library instance to share its interal registry.
Updated package.json
{
    "contributes": {
        "commands": [
            {
                "command": "myTraceExtension.showActiveTrace",
                "title": "Show Active Trace Info"
            },
            {
                "command": "myTraceExtension.openCustomView",
                "title": "Open Custom Trace View"
            }
        ]
    },
    "dependencies": {
        "traceviewer-base": "^0.9.0",
        "tsp-typescript-client": "^0.8.0"
    }
}
src/webview-provider.ts
The webview provider below creates a simple HTML page to be rendered in the webview. It uses the static custom-view.js for communicate with the vscode extension.
Notes:
- To have a more sophisticated webview content, you can use other technologies, e.g. react.js. See the
vscode-trace-extension's webviews implementation on how to create such react application and hook into a vcode webview. - To send TSP queries to the trace server backend the trace server URI has to be passed to the webview code. See
vscode-trace-extensionon how to do it. - This exmaple below uses the Flame Chart and Histogram data provider from the Trace Compass trace server and requires a LTTng UST trace to see output data visualized.
- To run custom analysis using the
Run Performance analysisorRun Memory analysisa trace server back-end is needed that implements those custom endpoints in order to get successful replies. Otherwise an error message is show on top of the page.
import * as vscode from 'vscode';
import { TspService } from './tsp-service';
import { QueryHelper } from 'tsp-typescript-client';
import { JSONBigUtils } from 'tsp-typescript-client/lib/utils/jsonbig-utils';

interface TraceDataRequest {
    experimentUUID: string;
}

interface TimeRangeRequest {
    experimentUUID: string;
    startTime: number;
    endTime: number;
}

interface AnalysisRequest {
    experimentUUID: string;
    analysisType: string;
}

export class CustomTraceViewProvider {
    private panel: vscode.WebviewPanel | undefined;
    private tspService: TspService;
    private extensionUri: vscode.Uri;

    constructor(private context: vscode.ExtensionContext, tspService: TspService) {
        this.tspService = tspService;
        this.extensionUri = context.extensionUri;
    }

    public async createWebview(experimentUUID: string, experimentName: string) {
        this.panel = vscode.window.createWebviewPanel(
            'customTraceView',
            `Custom View: ${experimentName}`,
            vscode.ViewColumn.One,
            {
                enableScripts: true,
                retainContextWhenHidden: true,
                localResourceRoots: [
                    vscode.Uri.joinPath(this.context.extensionUri, 'media'),
                    vscode.Uri.joinPath(this.context.extensionUri, 'src')
                ]
            }
        );
        this.panel.webview.html = this.getWebviewContent(this.panel.webview);
        this.setupMessenger(experimentUUID);


        // Load initial data
        await this.loadTraceData(experimentUUID);
    }

    private setupMessenger(experimentUUID: string) {
        if (!this.panel) return;

        this.panel.webview.onDidReceiveMessage(async (message) => {
            switch (message.method) {
                case 'loadTraceData':
                    await this.loadTraceData(experimentUUID);
                    break;
                case 'getTimeRange':
                    await this.getTimeRange(experimentUUID, message.params.startTime, message.params.endTime);
                    break;

                case 'runAnalysis':
                    await this.runCustomAnalysis(experimentUUID, message.params.analysisType);
                    break;

            }
        });
    }

    private async loadTraceData(experimentUUID: string) {
        if (!this.panel) {
            return;
        }

        try {
            // Get trace metadata
            const metadata = await this.tspService.getTraceMetadata(experimentUUID);

            // Get time graph data
            const timeGraphData = await this.getTimeGraphData(experimentUUID);

            // Get XY chart data
            const xyData = await this.getXYData(experimentUUID);

            const data = {
                metadata,
                timeGraph: timeGraphData,
                xyChart: xyData
            };
            // Send serialized TSP data to webview (Use JSONBigUtils due BigInts in data)
            this.panel.webview.postMessage({ method: "dataUpdated", data: JSONBigUtils.stringify(data) });
        } catch (error) {
            const errorInfo = `Failed to load data: ${error}`;
            if (this.panel) {
                this.panel.webview.postMessage({ method: "errorMsg", message: errorInfo });
            }
            throw new Error(errorInfo);
        }
    }

    private async getTimeGraphData(experimentUUID: string) {
        // Data provider ID of interest
        const dpId = 'org.eclipse.tracecompass.internal.analysis.profiling.callstack.provider.CallStackDataProvider';
        const parameters = QueryHelper.timeRangeQuery(BigInt(0), BigInt(1000000));

        // Query the tree end point to get the row IDs (entry IDs) for the state query
        const response = await this.tspService.client.fetchTimeGraphTree(experimentUUID, dpId, parameters);
        if (response.isOk()) {
            const tree = response.getModel();
            if (tree?.model?.entries && tree?.model?.entries.length < 3) {
                return;
            }
            const items: number[] = [];
            items.push(tree?.model.entries[0].id ?? 0);
            items.push(tree?.model.entries[1].id ?? 1);
            items.push(tree?.model.entries[2].id ?? 2);

            const stateDataParameters = QueryHelper.selectionTimeRangeQuery(
                BigInt(0),
                BigInt(1000000),
                100,
                items
            );
            const statesResponse = await this.tspService.client.fetchTimeGraphStates(
                experimentUUID,
                dpId,
                stateDataParameters
            );

            // Return TSP models that will be serialized properly
            return {
                tree: tree,
                states: statesResponse.isOk() ? statesResponse.getModel() : null
            };
        }
        return null;
    }

    private async getXYData(experimentUUID: string) {
        // Data provider ID of interest
        const dpId = "org.eclipse.tracecompass.internal.tmf.core.histogram.HistogramDataProvider";
        const parameters = QueryHelper.timeRangeQuery(BigInt(0), BigInt(1000000));

        // Query the tree end point to get the row IDs (entry IDs) for the XY series query
        const treeResponse = await this.tspService.client.fetchXYTree(experimentUUID, dpId, parameters);
        if (treeResponse.isOk()) {
            const tree = treeResponse.getModel();
            if (tree?.model?.entries && tree?.model?.entries.length < 2) {
                return;
            }
            const items: number[] = [];
            items.push(tree?.model.entries[0].id ?? 0);
            items.push(tree?.model.entries[1].id ?? 1);

            const xyDataParameters = QueryHelper.selectionTimeRangeQuery(
                BigInt(0),
                BigInt(1000000),
                100,
                items
            );
            const response = await this.tspService.client.fetchXY(
                experimentUUID,
                dpId,
                xyDataParameters
            );
            // Return TSP XY model that will be serialized properly
            return response.isOk() ? response.getModel() : null;
        }
        return null;
    }

    private async getTimeRange(experimentUUID: string, startTime: number, endTime: number) {
        if (!this.panel) {
            return;
        }
                // Data provider ID of interest
        const dpId = 'org.eclipse.tracecompass.internal.analysis.profiling.callstack.provider.CallStackDataProvider';
        const parameters = QueryHelper.timeRangeQuery(BigInt(0), BigInt(1000000));

        // Query the tree end point to get the row IDs (entry IDs) for the state query
        const treeResponse = await this.tspService.client.fetchTimeGraphTree(experimentUUID, dpId, parameters);
        if (treeResponse.isOk()) {
            const tree = treeResponse.getModel();
            if (tree?.model?.entries && tree?.model?.entries.length < 2) {
                return;
            }
            const items: number[] = [];
            items.push(tree?.model.entries[0].id ?? 0);
            items.push(tree?.model.entries[1].id ?? 1);
            items.push(tree?.model.entries[1].id ?? 2);

            const stateDataParameters = QueryHelper.selectionTimeRangeQuery(
                BigInt(startTime),
                BigInt(endTime),
                100,
                items);
            const statesResponse = await this.tspService.client.fetchTimeGraphStates(
                experimentUUID,
                dpId,
                stateDataParameters
            );
            const data = statesResponse.isOk() ? statesResponse.getModel() : null;
            // Send serialized TSP data to webview (Use JSONBigUtils due BigInts in data)
            this.panel.webview.postMessage({ method: "timeRangeData", data: JSONBigUtils.stringify(data) });
        }
        return null;
    }

    private async runCustomAnalysis(experimentUUID: string, analysisType: string) {
        if (!this.panel) {
            return;
        }
        const analysisId = await this.tspService.runCustomAnalysis(experimentUUID, analysisType);
        if (analysisId) {
            // Send serialized TSP data to webview (Use JSONBigUtils due BigInts in data)
            this.panel.webview.postMessage({ method: "analysisStarted", data: analysisId });
            return;
        }
        this.panel.webview.postMessage({ method: "errorMsg", message: 'Failed to start analysis' });
    }

    private getWebviewContent(webview: vscode.Webview): string {

        // Get the local path to main script run in the webview, then convert it to a uri we can use in the webview.
        const scriptUri = webview.asWebviewUri(vscode.Uri.joinPath(this.extensionUri, 'src', 'custom-view.js'));
        const baseUri = webview.asWebviewUri(vscode.Uri.joinPath(this.extensionUri));

        return `
<!DOCTYPE html>
<html lang="en">
<head>
    <meta charset="UTF-8">
    <meta name="viewport" content="width=device-width, initial-scale=1.0">
    <title>Custom Trace View</title>
    <style>
        body { font-family: Arial, sans-serif; margin: 20px; }
        .container { display: flex; flex-direction: column; gap: 20px; }
        .section { border: 1px solid #ccc; padding: 15px; border-radius: 5px; }
        .controls { display: flex; gap: 10px; margin-bottom: 10px; }
        button { padding: 8px 16px; cursor: pointer; }
        .chart-container { height: 300px; border: 1px solid #ddd; position: relative; }
        .time-graph { background: #f9f9f9; }
        .xy-chart { background: #f0f8ff; }
        .metadata { background: #f5f5f5; }
        .loading { text-align: center; color: #666; }
        .error { color: red; }
        .state-bar { height: 20px; margin: 2px 0; position: relative; }
        .time-range { display: flex; gap: 10px; align-items: center; }
        input[type="number"] { width: 100px; }
    </style>
    <meta http-equiv="Content-Security-Policy"
		content="default-src 'none';
		img-src ${webview.cspSource};
        script-src 'self' ${webview.cspSource} 'unsafe-inline';
		style-src 'self' 'unsafe-inline' ${webview.cspSource};
		font-src ${webview.cspSource}">
        <base href="${baseUri}/">
</head>
<body>
    <div class="container">
        <div class="section">
            <h3>Controls</h3>
            <div class="controls">
                <button onclick="refreshData()">Refresh Data</button>
                <button onclick="runAnalysis('performance')">Run Performance Analysis</button>
                <button onclick="runAnalysis('memory')">Run Memory Analysis</button>
            </div>
            <div class="time-range">
                <label>Time Range:</label>
                <input type="number" id="startTime" placeholder="Start" value="0">
                <input type="number" id="endTime" placeholder="End" value="1000000">
                <button onclick="getTimeRange()">Get Range Data</button>
            </div>
        </div>

        <div class="section metadata">
            <h3>Trace Metadata</h3>
            <div id="metadata-content">Loading...</div>
        </div>

        <div class="section">
            <h3>Time Graph View</h3>
            <div class="chart-container time-graph" id="timegraph-container">
                <div class="loading">Loading time graph data...</div>
            </div>
        </div>

        <div class="section">
            <h3>XY Chart View</h3>
            <div class="chart-container xy-chart" id="xy-container">
                <div class="loading">Loading XY chart data...</div>
            </div>
        </div>

        <div class="section">
            <h3>Analysis Results</h3>
            <div id="analysis-results">No analysis running</div>
        </div>
    </div>
    <script src="${scriptUri}"></script>
</body>
</html>`;
    }
}
src/custom-view.js
//const vscode_messenger = require("vscode-messenger-webview");

const vscode = acquireVsCodeApi();

window.addEventListener('message', event => {
    const message = event.data; // The JSON data our extension sent
    switch (message.method) {
    case 'dataUpdated':
        console.log("dataUpdated");
        // Use JsonBigUtils.parse() instead if the data contains serialized bigint values
        updateDisplay(JSON.parse(message.data));
        break;
    case 'timeRangeData':
        console.log("timeRangeData");
        // Use JsonBigUtils.parse() instead if the data contains serialized bigint values
        updateTimeRangeData(JSON.parse(message.data));
        break;
    case 'analysisStarted':
        console.log("analysisStarted");
        document.getElementById('analysis-results').innerHTML =
            `Analysis started with ID: ${data.analysisId}`;
        break;
    case 'errorMsg':
        console.log("errorMsg");
        showError(message.message);
    }
});

window.refreshData = async function () {
    console.log("Refresh Data called");
    vscode.postMessage({ method: 'loadTraceData' });
};

window.getTimeRange = async function () {
    console.log("Get Time Range Called");

    const startTime = parseInt(document.getElementById('startTime').value) || 0;
    const endTime = parseInt(document.getElementById('endTime').value) || 1000000;

    vscode.postMessage({ method: 'getTimeRange',
        params: {
             startTime: startTime,
             endTime: endTime
        }
     });
};

window.runAnalysis = async function(type) {
    vscode.postMessage({ method: 'runAnalysis',
        params: {
             analysisType: type
        }
     });
}

function updateDisplay(data) {
    // Update metadata
    if (data.metadata) {
        document.getElementById('metadata-content').innerHTML =
            `<pre>${JSON.stringify(data.metadata, null, 2)}</pre>`;
    } else {
        document.getElementById('metadata-content').innerHTML = '<div class="loading">No metadata available</div>';
    }

    // Update time graph
    updateTimeGraph(data.timeGraph);

    // Update XY chart
    updateXYChart(data.xyChart);
}

function updateTimeGraph(timeGraphData) {
    const container = document.getElementById('timegraph-container');

    if (timeGraphData?.tree && timeGraphData?.tree?.model && timeGraphData.states) {
        let html = '<div style="padding: 10px;">';
        let cnt = 0;

        for (let entry of timeGraphData?.tree?.model?.entries) {
            html += `<div style="margin: 5px 0;">
                        <strong>${entry.labels[0]}</strong>
                        <div class="state-bar" style="background: linear-gradient(to right, #4CAF50 0%, #2196F3 50%, #FF9800 100%);"></div>
                    </div>`;
            cnt++;
            if (cnt > 5 || cnt >= timeGraphData?.tree?.model?.entries?.length) {
                break;
            }
        }
        html += '</div>';
        container.innerHTML = html;
    } else {
        container.innerHTML = '<div class="loading">No time graph data available</div>';
    }
}

function updateXYChart(xyData) {
    const container = document.getElementById('xy-container');

    if (xyData && xyData.model?.series) {
        let html = '<div style="padding: 10px;">';
        html += `<p>Series count: ${xyData.model.series.length}</p>`;

        xyData.model.series.forEach((series, index) => {
            html += `<div style="margin: 10px 0;">
                        <strong>Series ${index + 1}:</strong> ${series.seriesName || 'Unnamed'}
                        <div style="height: 20px; background: linear-gradient(to right, #FF6B6B, #4ECDC4); margin: 5px 0;"></div>
                    </div>`;
        });

        html += '</div>';
        container.innerHTML = html;
    } else {
        container.innerHTML = '<div class="loading">No XY chart data available</div>';
    }
}

function updateTimeRangeData(data) {
    if (data) {
        document.getElementById('analysis-results').innerHTML =
            `<h4>Time Range Data:</h4><pre>${JSON.stringify(data, null, 2)}</pre>`;
    } else {
        document.getElementById('analysis-results').innerHTML = '<div class="loading">No time range data available</div>';
    }
}

function showError(message) {
    const errorDiv = document.createElement('div');
    errorDiv.className = 'error';
    errorDiv.textContent = message;
    document.body.insertBefore(errorDiv, document.body.firstChild);

    setTimeout(() => errorDiv.remove(), 5000);
}
Updated src/tsp-service.ts
export class TspService {
    public client: ExtendedTspClient; // Make client public for webview access

    // ... existing methods ...
}
Key Features of the Custom Webview:
- TSP Data Integration - Queries time graph trees, states, and XY chart data
- Interactive Controls - Buttons for refreshing data and running analysis
- Time Range Selection - Input fields for querying specific time ranges
- Real-time Updates - Receives data updates from the extension
- Error Handling - Displays errors and loading states
- Multiple Visualizations - Shows metadata, time graphs, and XY charts
- Bidirectional Communication - Webview can request data from extension
Webview Capabilities:
- Displays trace metadata in JSON format
- Visualizes time graph entries with colored state bars
- Shows XY chart series information
- Allows custom time range queries
- Triggers custom analysis operations
- Provides real-time feedback and error handling
This example demonstrates how to create a fully functional webview that integrates with both the trace extension API and TSP client to provide custom data visualization capabilities.