| title | Automated Freshness & Volume Monitors |
|---|---|
| sidebarTitle | Introduction |
import CloudFeatureTag from '/snippets/cloud/cloud-feature-tag.mdx'; import AutomatedMonitorsIntro from '/snippets/cloud/features/anomaly-detection/automated-monitors-intro.mdx'; import AutomatedMonitorsCards from '/snippets/cloud/features/anomaly-detection/automated-monitors-cards.mdx';
Once your environment is set up, we automatically collect metadata from your warehouse, which our ML models run on. The models are operational when the initial backfill is completed, there is no "loading / training period" - Elementary will collect enough historical data after setup to train the models.
Monitors are automatically created on all of your sources, and additional ones can be added, edited and removed manually. Their results are displayed in the application in the same way as package tests.
- Zero configuration - Our machine learning models learn data behavior, eliminating the need for manual configuration.
- Out-of-the-box coverage - Rather than manually configuring a test for each model, Elementary automatically creates monitors for every source in your dbt project once you set up your environment.
- Metadata only, minimal cost - The monitors rely on data warehouse metadata, and don't consume compute resources.
The monitors collect metadata, and the anomaly detection model adjusts based on updates frequency, seasonality and trends.
As soon as you connect Elementary Cloud Platform to your data warehouse, a backfill process will begin to collect historical metadata. Within an average of a few hours, your automated monitors will be operational. By default, Elementary collects at least 21 days of historical metadata.
The automated monitors are created for all the sources in your dbt project. If you would like a different configuration of which tables to create the monitors on, or adding monitors for all models, you can reach out to us.
You can fine tune the configuration and provide feedback to adjust the detection to your needs.
As views are stateless, automated volume and freshness monitors only apply on tables.
By default, automated monitors failures don't create alerts.
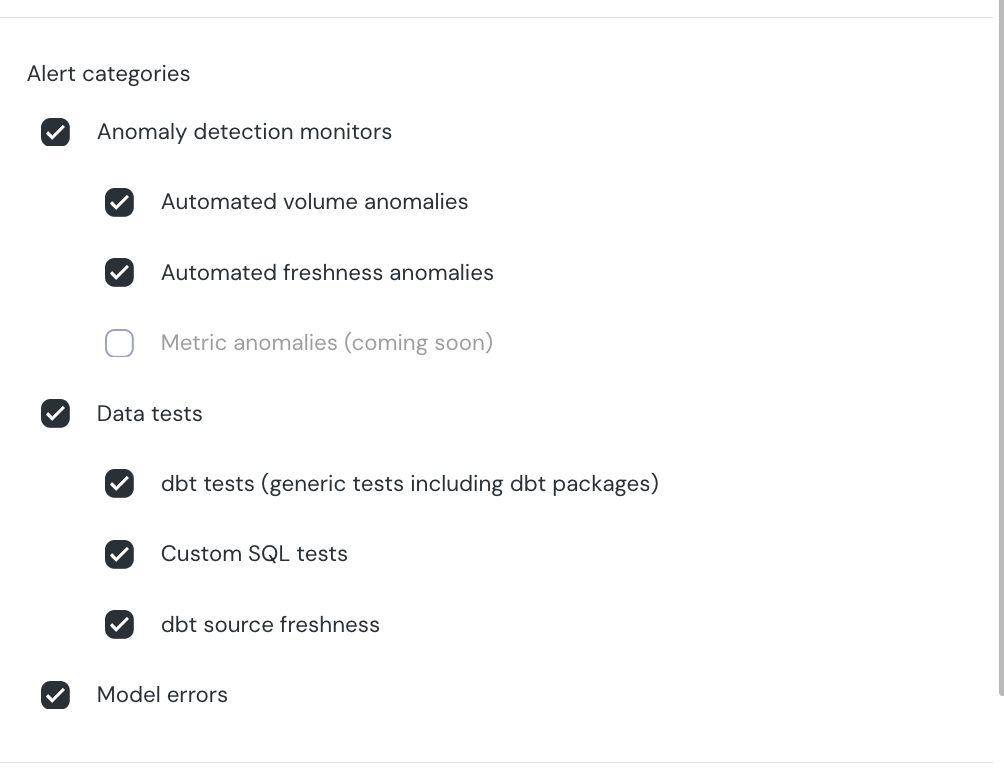
To activate alerts on automated monitors, navigate to Setup > Alert Rules.
- To alert on all automated monitors failures - Change the default rule (#1) alert categories to include automated monitors.
- To alert on specific datasets - Change / Create alert rules for these specific datasets, and include automated monitors in their alert categories.