David Kenfak proposed to add a funciton to easily plot dbh classes by species.
library(tidyverse)
#> Warning: package 'purrr' was built under R version 3.5.3
library(skimr)
#> Warning: package 'skimr' was built under R version 3.5.3
#>
#> Attaching package: 'skimr'
#> The following object is masked from 'package:stats':
#>
#>     filter

census <- fgeo.data::luquillo_tree5_random %>%
  filter(!is.na(dbh)) %>%
  filter(sp %in% unique(sp)[1:3])

# Plot
census %>%
  group_by(sp) %>%
  ggplot(aes(dbh)) +
  geom_histogram() +
  facet_wrap("sp", ncol = 1)
#> `stat_bin()` using `bins = 30`. Pick better value with `binwidth`.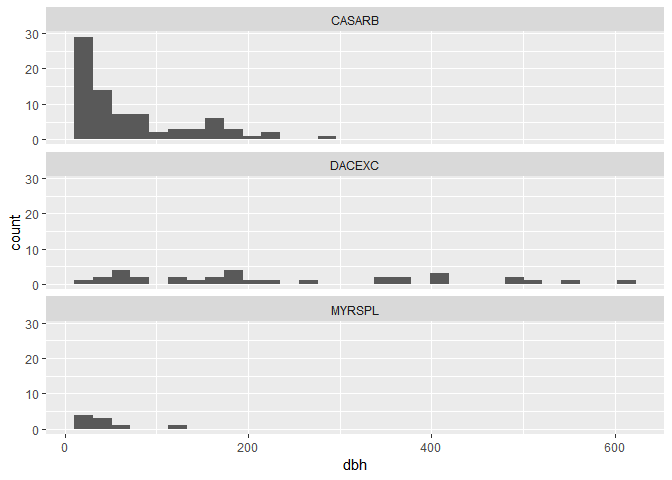
Created on 2019-03-18 by the reprex package (v0.2.1)
--
A quick histogram may also be useful in the form of a table with the skimr package
library(tidyverse)
# Table
census %>%
  select(sp, matches("dbh")) %>%
  group_by(sp) %>%
  skim(dbh)
David Kenfak proposed to add a funciton to easily plot dbh classes by species.
Created on 2019-03-18 by the reprex package (v0.2.1)
--
A quick histogram may also be useful in the form of a table with the skimr package