You signed in with another tab or window. Reload to refresh your session.You signed out in another tab or window. Reload to refresh your session.You switched accounts on another tab or window. Reload to refresh your session.Dismiss alert
Let's learn about Logging via these 77 free blog posts. They are ordered by HackerNoon reader engagement data. Visit the /Learn or LearnRepo.com to find the most read blog posts about any technology.
Logging is the process of recording events that occur within a software application or system. It matters for debugging, monitoring performance, identifying security incidents, and providing an audit trail for system activities.
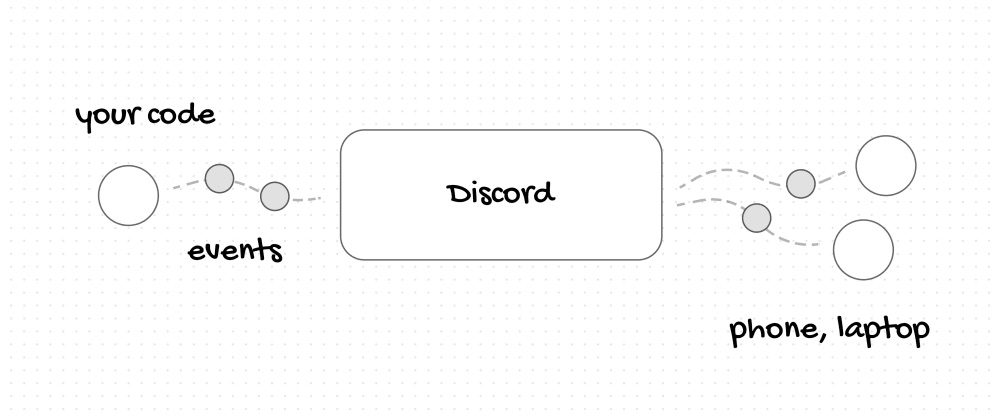
Logging and monitoring are like Tony Stark and his Iron Man suit, the two will go together. Similarly, logging and monitoring work best together because they complement each other well.
Console statements create performance or security issues if you mishandle them. This article explains three ways to remove them from your production build.
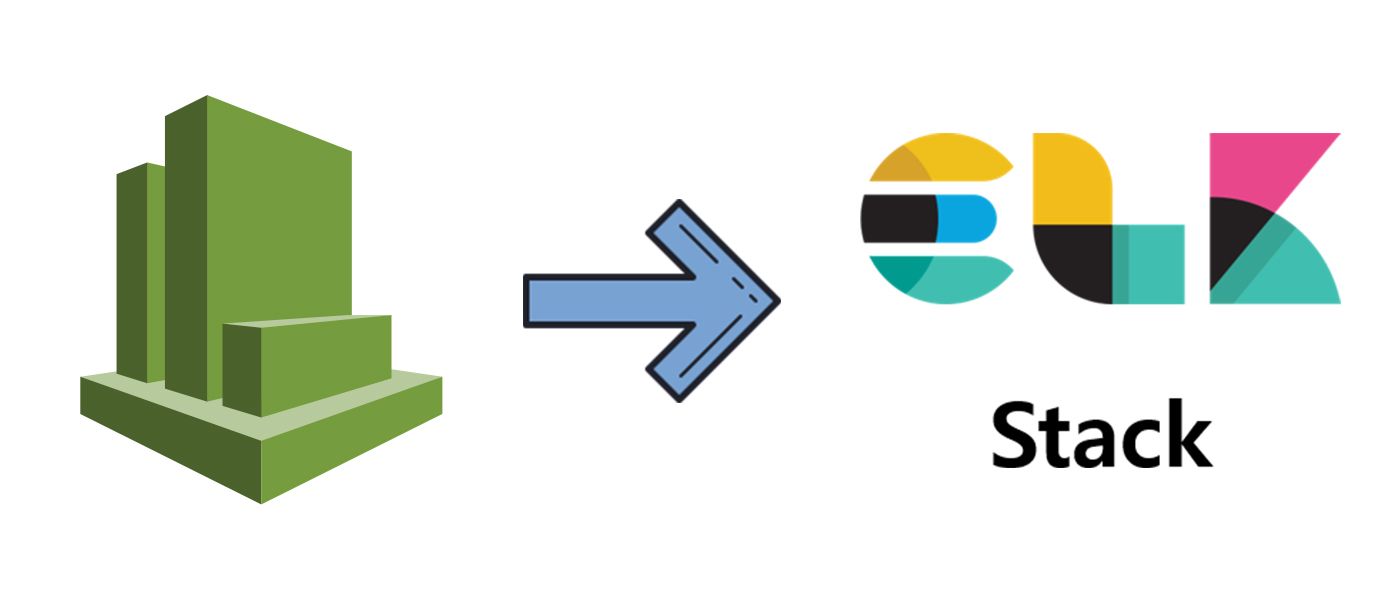
Cloudwatch is an AWS service that allows storage and monitoring of your application logs from an array of AWS services. This can be really useful for creating alerts to notify developers when a certain threshold of errors has been hit, but sometimes we might need to deeply analyse our logs, not only to spot errors but to find insights into our application and improve performance. This is where an ELK (Elasticsearch, Logstash, Kibana) stack can really outperform Cloudwatch. ELK allows us to collate data from any source, in any format, and to analyse, search and visualise the data in real time.
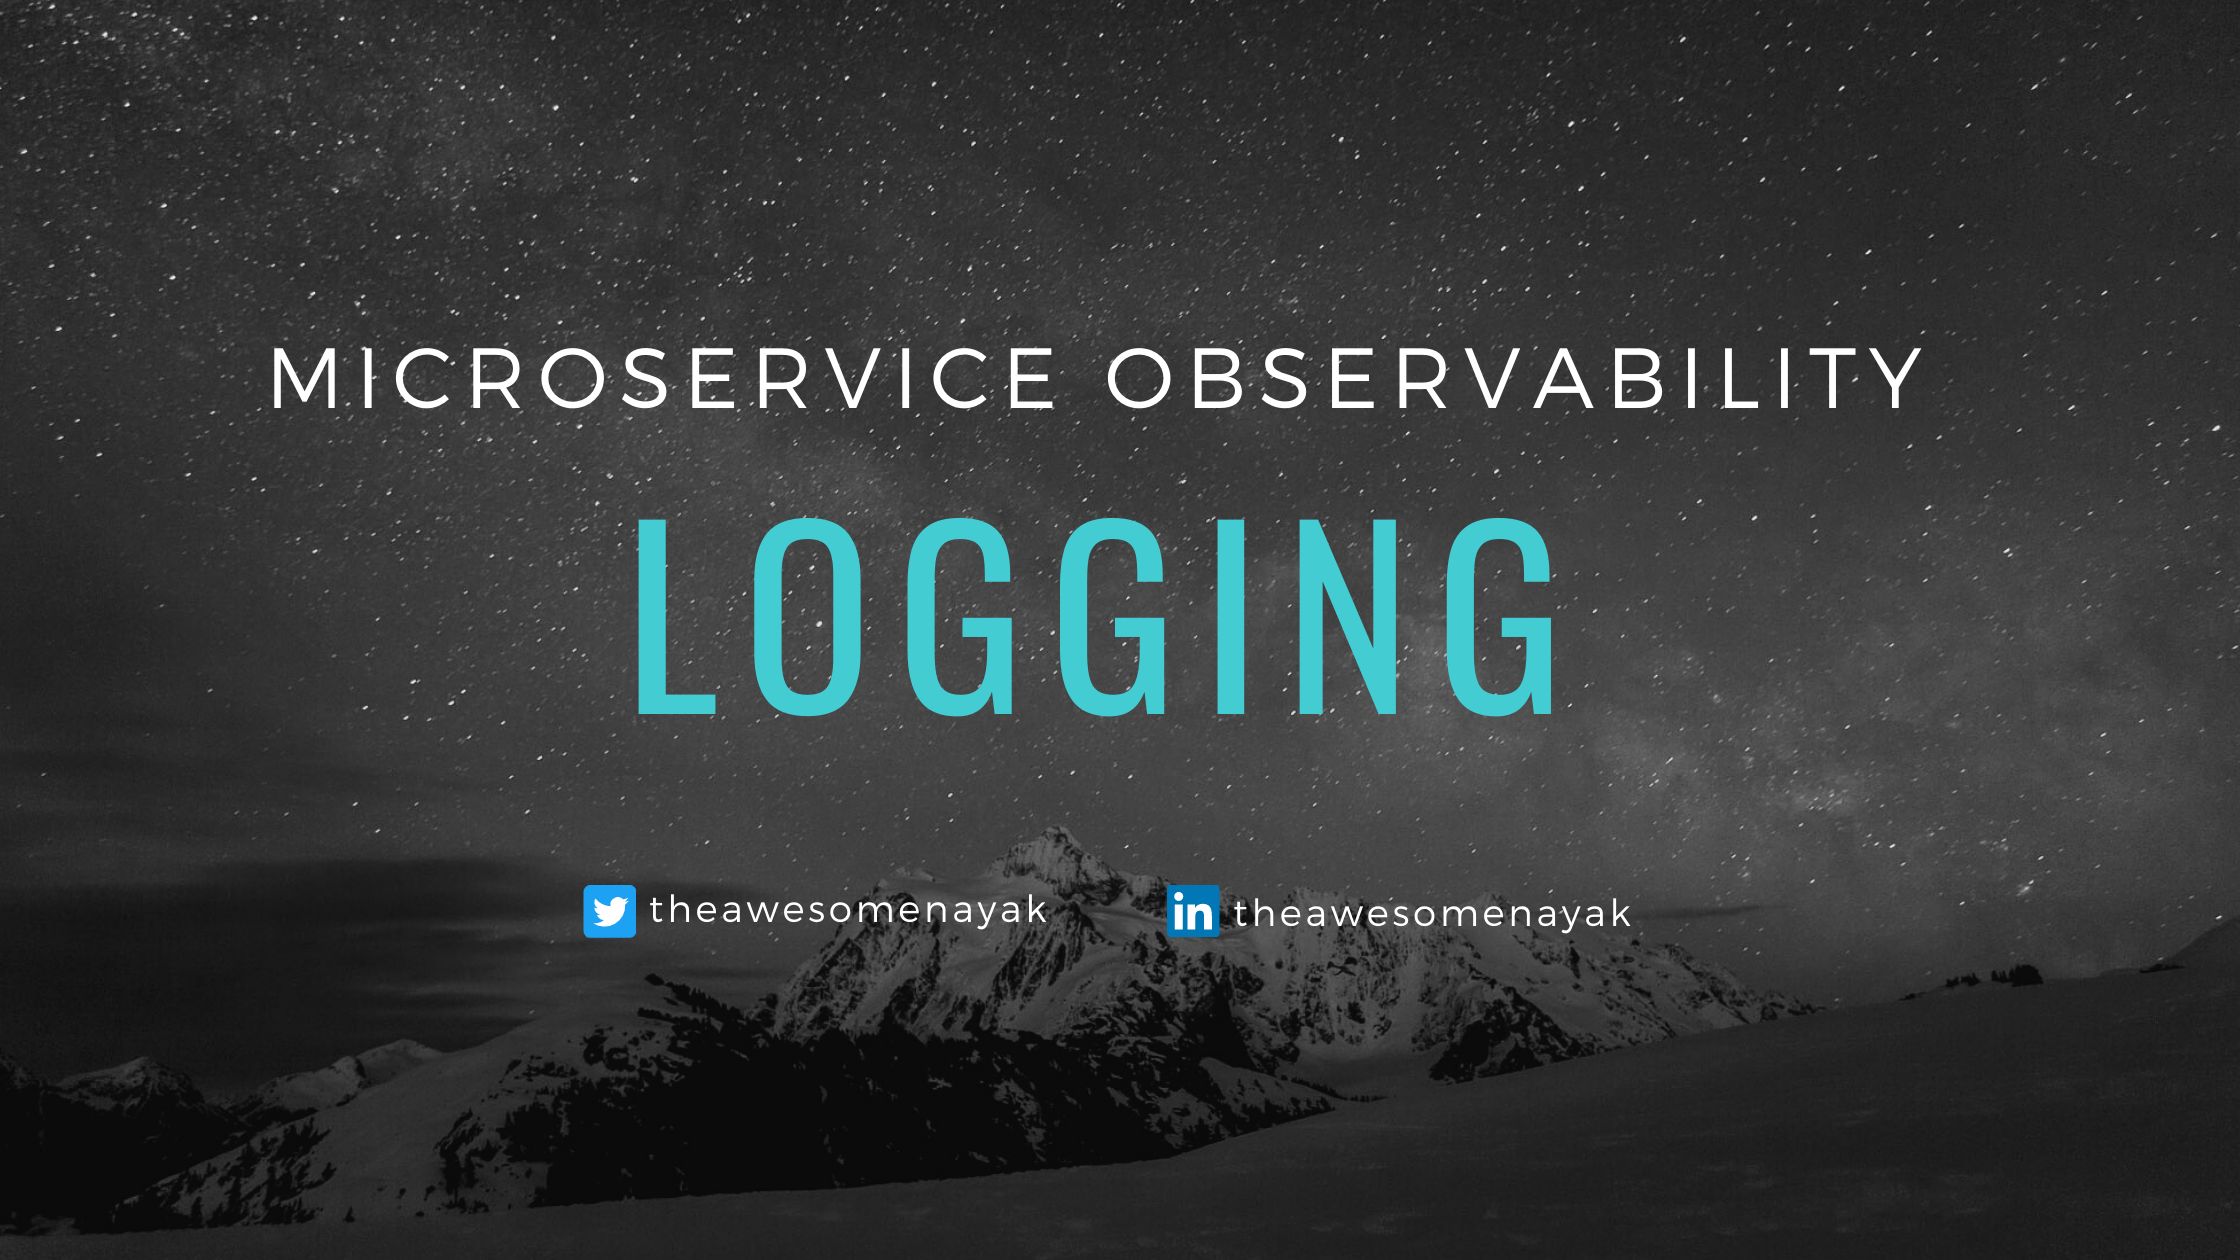
You are reading this content, which means that you are not novice to the microservices field. So let me just scratch the surface of it before moving to Observable Microservices. Once upon a time Monolith Application was now transformed into Microservices based application.
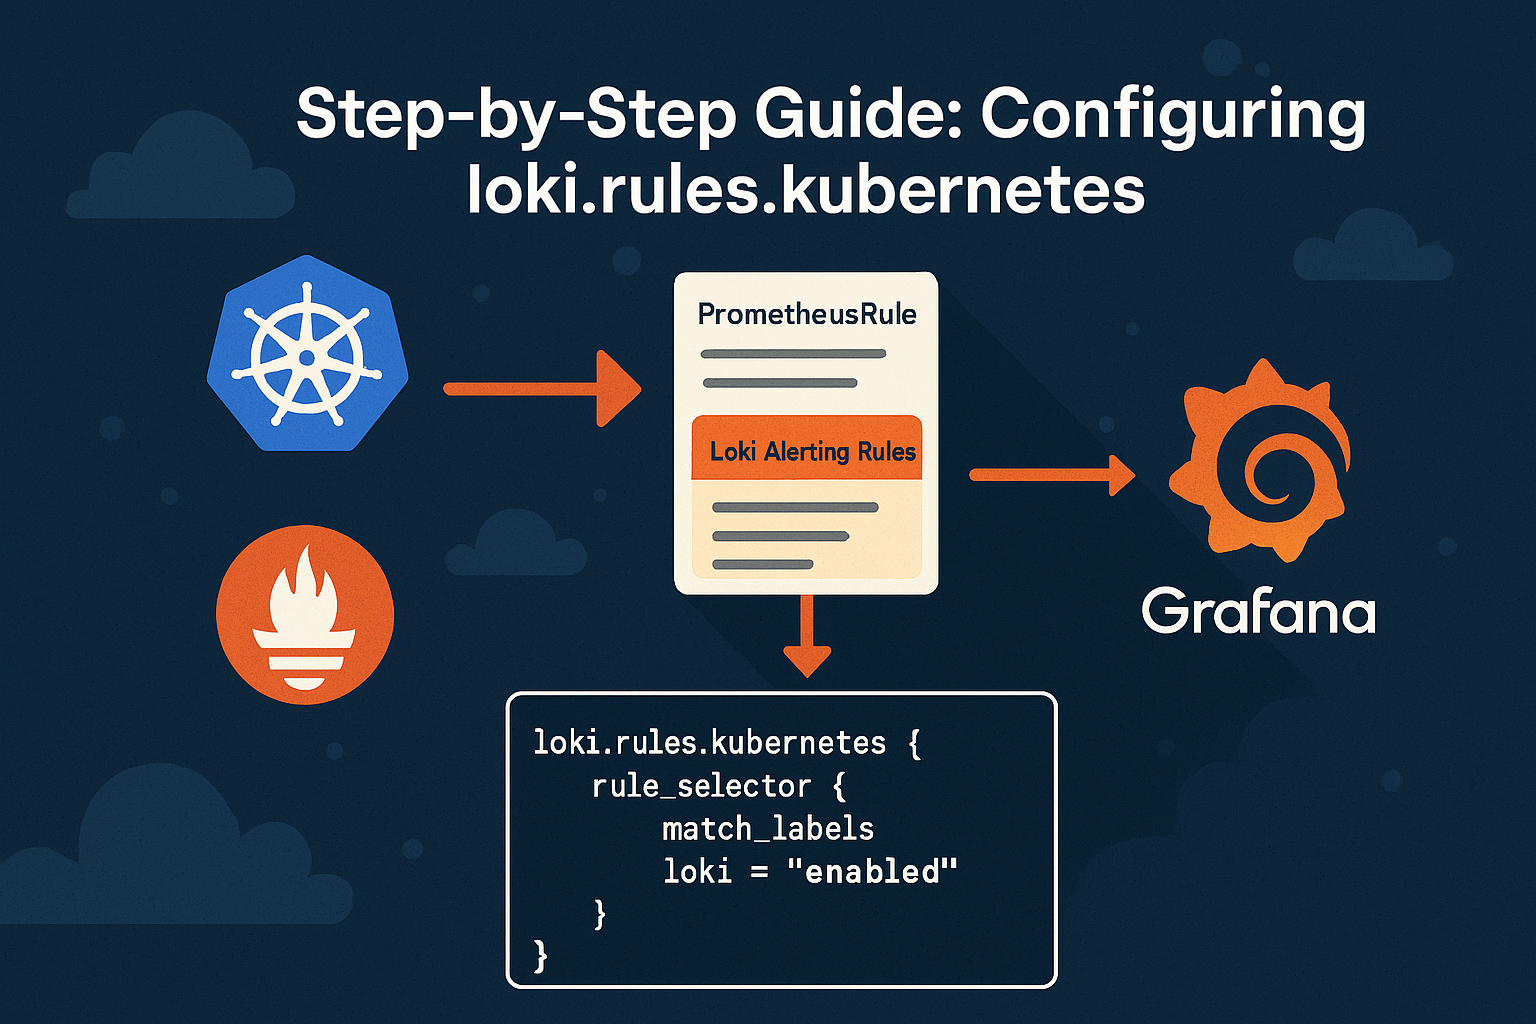
Master Google Cloud Log Explorer for effective troubleshooting. Learn log filtering, root cause analysis, and best practices for resolving Kubernetes issues.
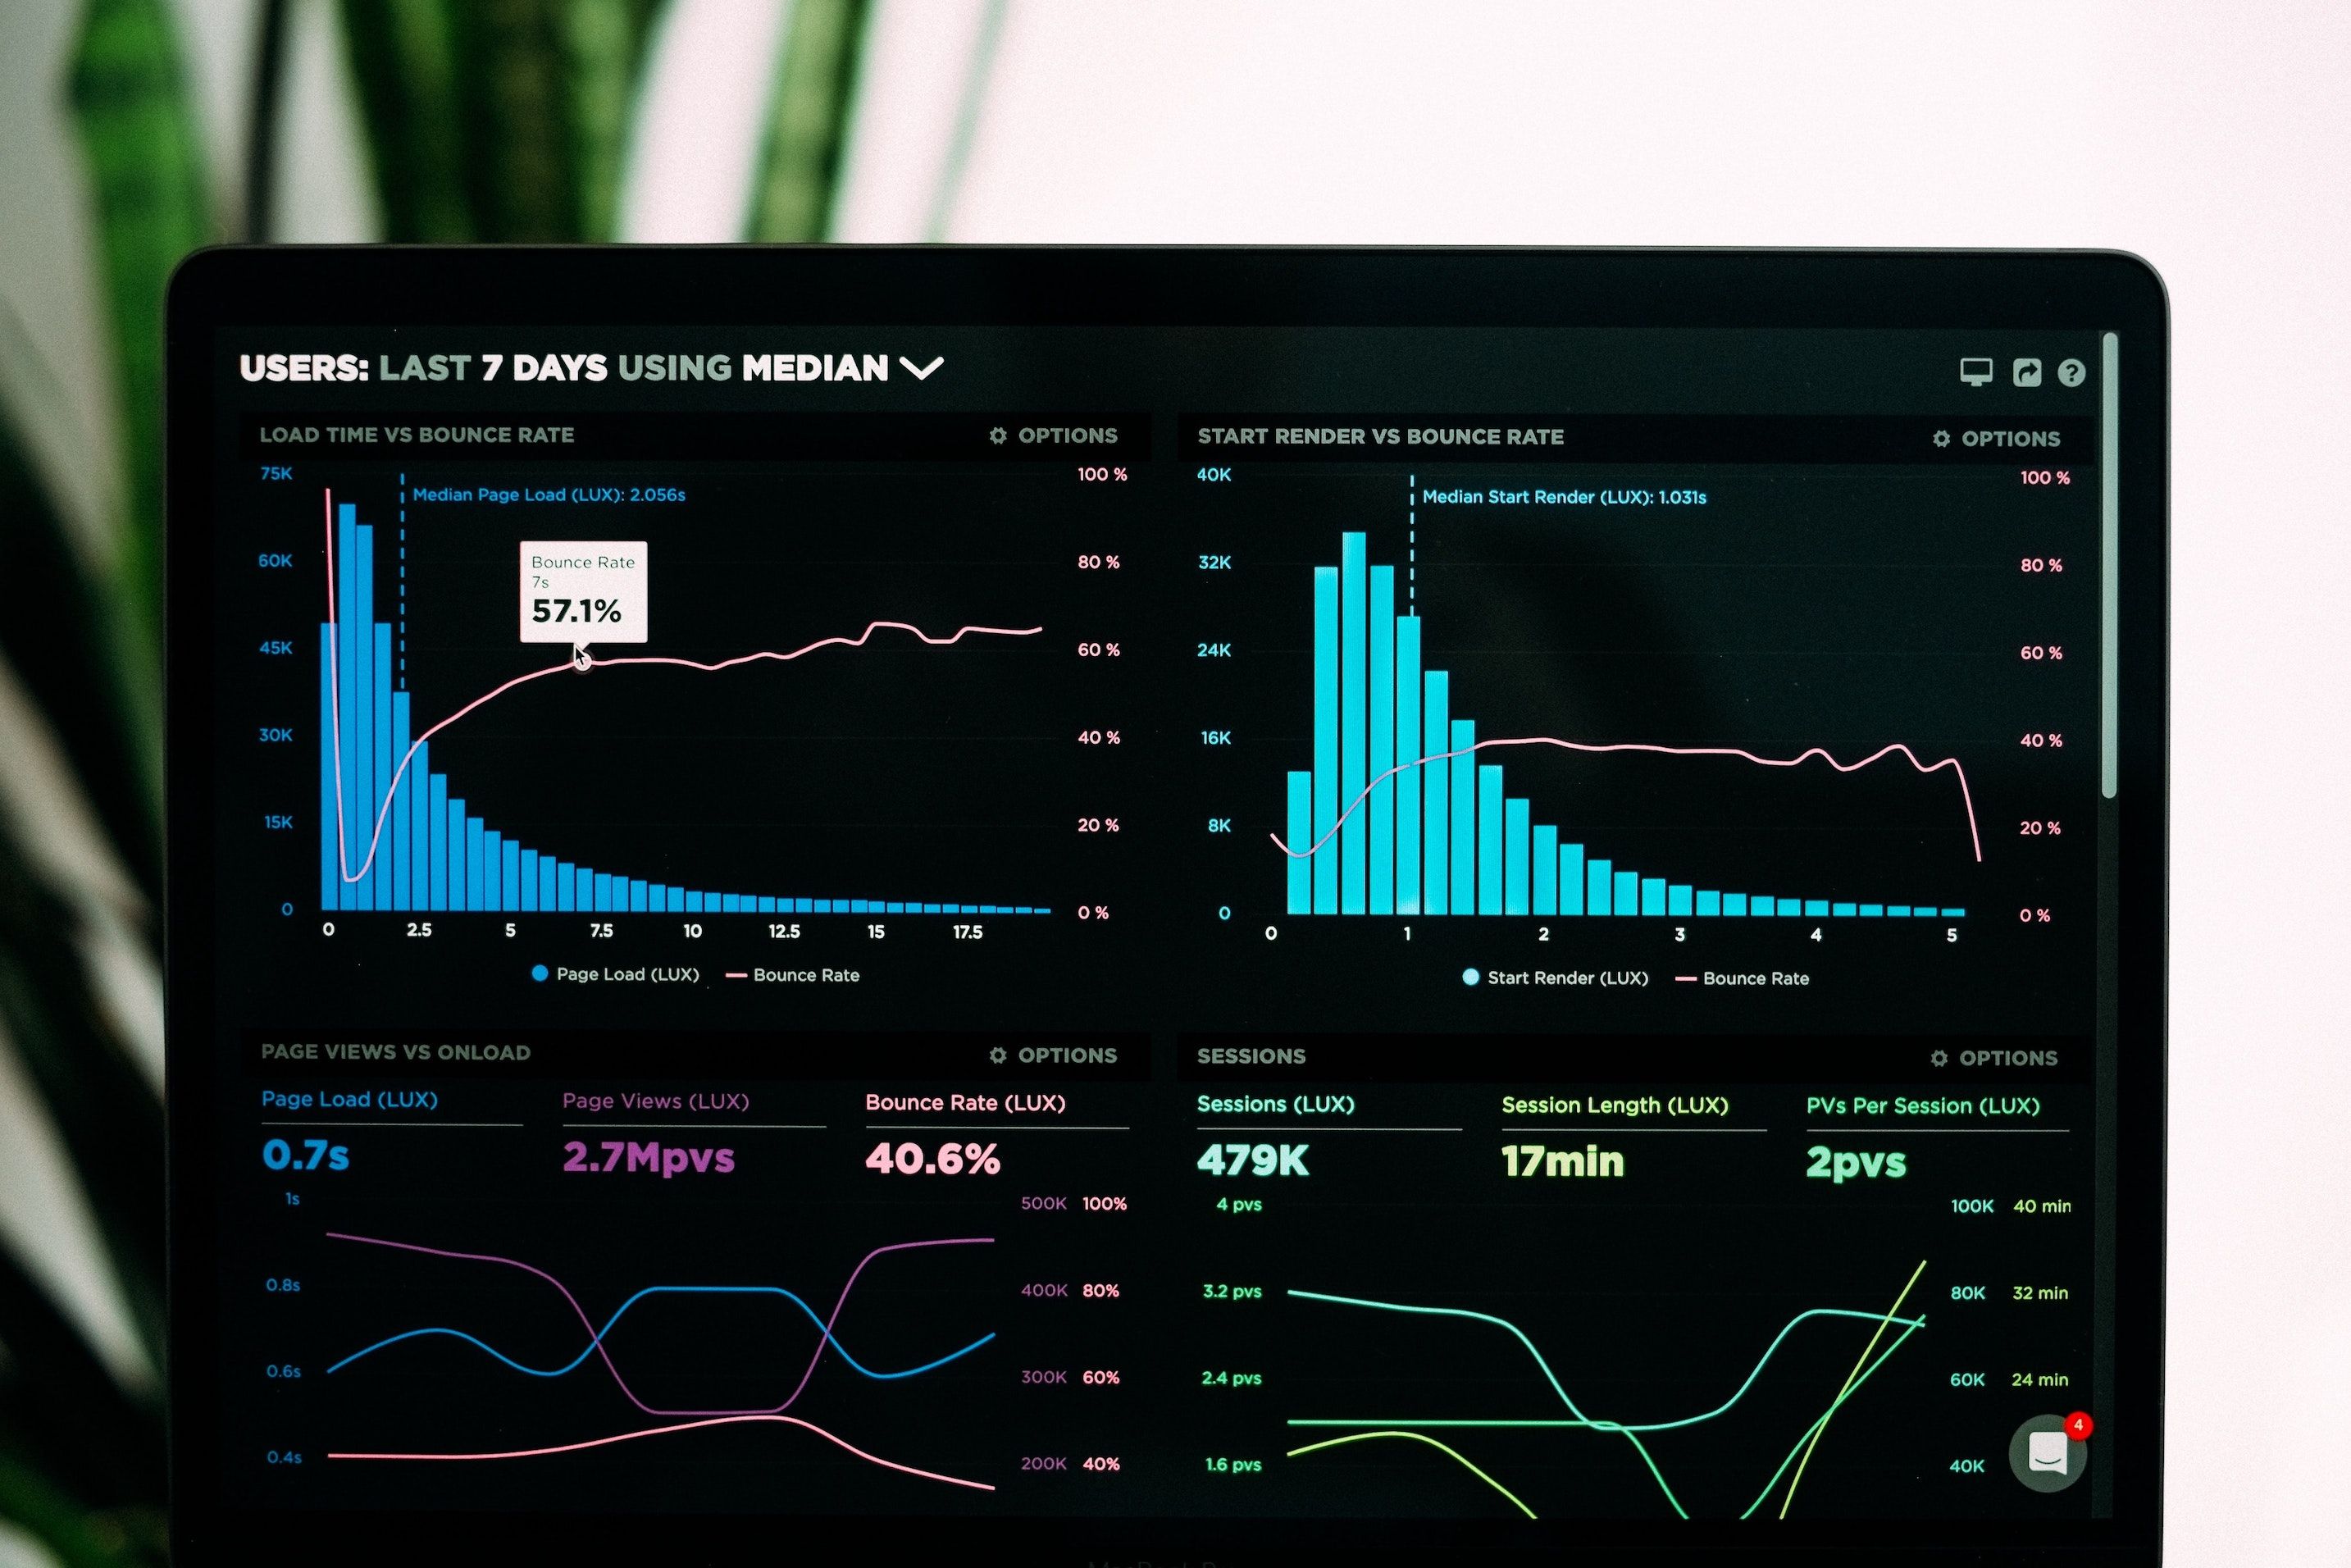
Logging for observability across languages, frameworks, and packages is challenging. A thoughtful approach to log design, metrics, and retention will help.
Kubernetes (a.k.a K8s) is the de-facto standard of container orchestration software backed by Google and one of the most active open source projects. If you are using Docker it is very likely that you are using Kubernetes or at least have heard about it.
Understand the SEC's new cybersecurity rules for public companies, and key tools (SIEM, logging, monitoring) for compliance in incident detection and response.
Logging is one of the most important parts of software systems. Whether you have just started working on a new piece of software, or your system is running in a large scale production environment, you’ll always find yourself seeking help from log files. Logs are the first thing people look for when something goes wrong, or something doesn’t work as expected.
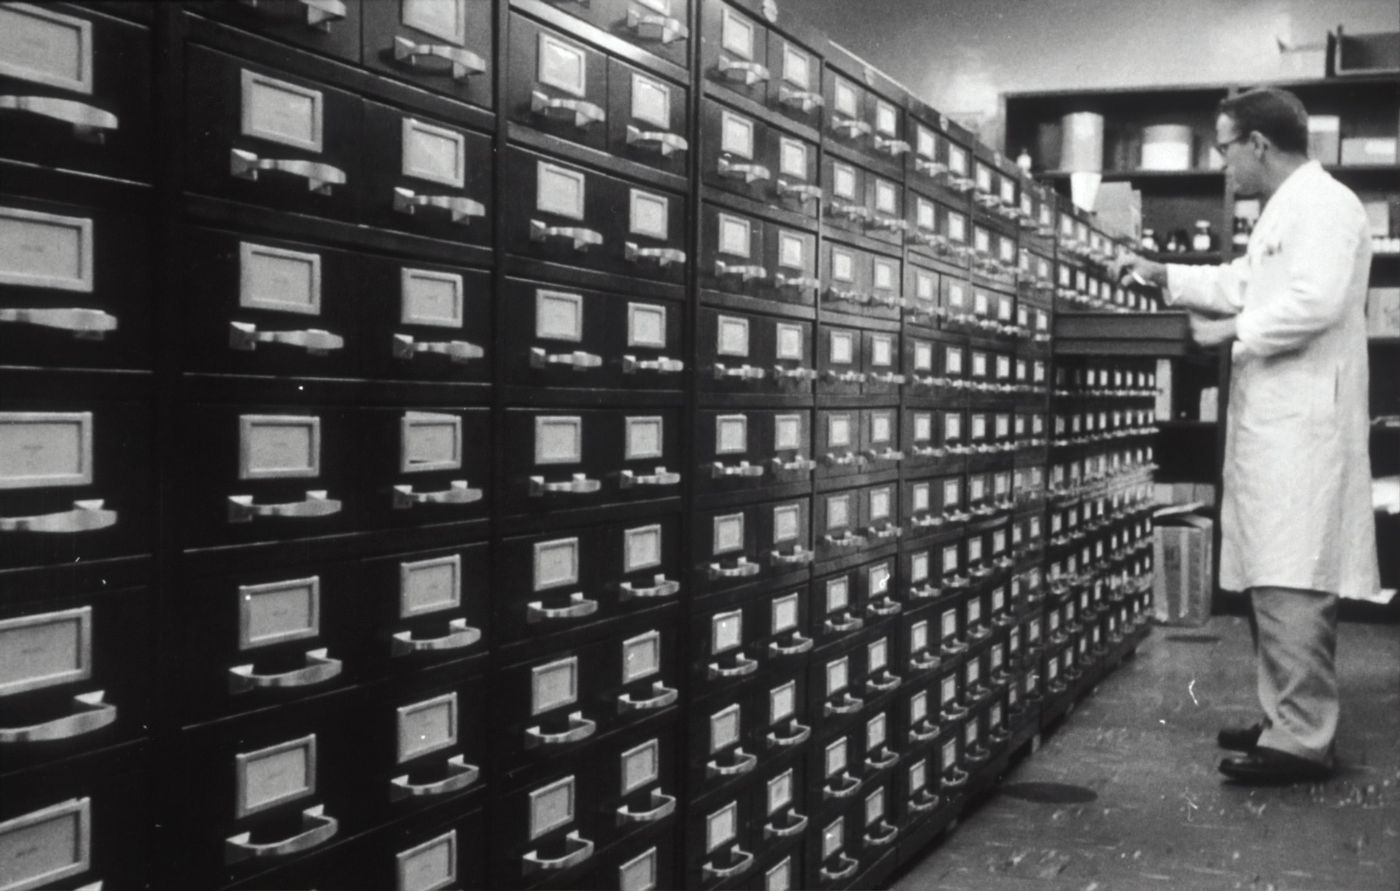
The story of event logging begins at sea and is related to navigation. One of the important aspects of navigation is dead reckoning: estimating your current position based on course, speed and time from a known, observed point. In the end of 15th century, speed at sea was measured with a small wooden log. A so-called ‘Dutchman’s Log’ was dropped overboard from the bow of the ship and the navigator measured the time elapsing before it passed the stern.
In this tutorial, we will look at PHP logging. Specifically, we will learn how to configure logs, how to show logs, and how to employ best logging practices.
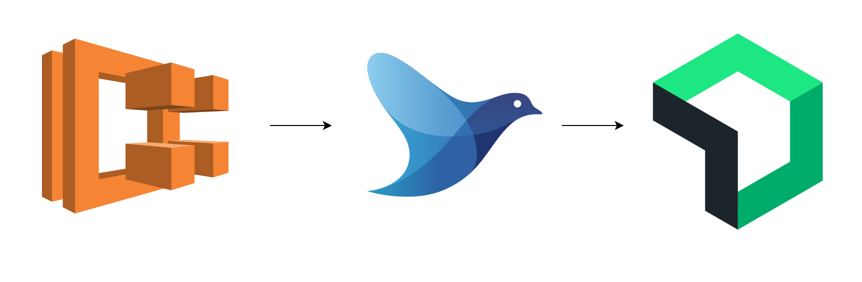
In this article, I share my experience setting up logging for our project. The main focus will be on configuring Fluent Bit, which we used for log forwarding.
Sidekick is a live application debugger that lets you troubleshoot your applications while they keep on running. Here is how you can start using it in 5 minutes
Apache Doris provides a new data type: Variant, for semi-structured data analysis, which enables 8 times faster query performance than JSON with 1/3 storage.
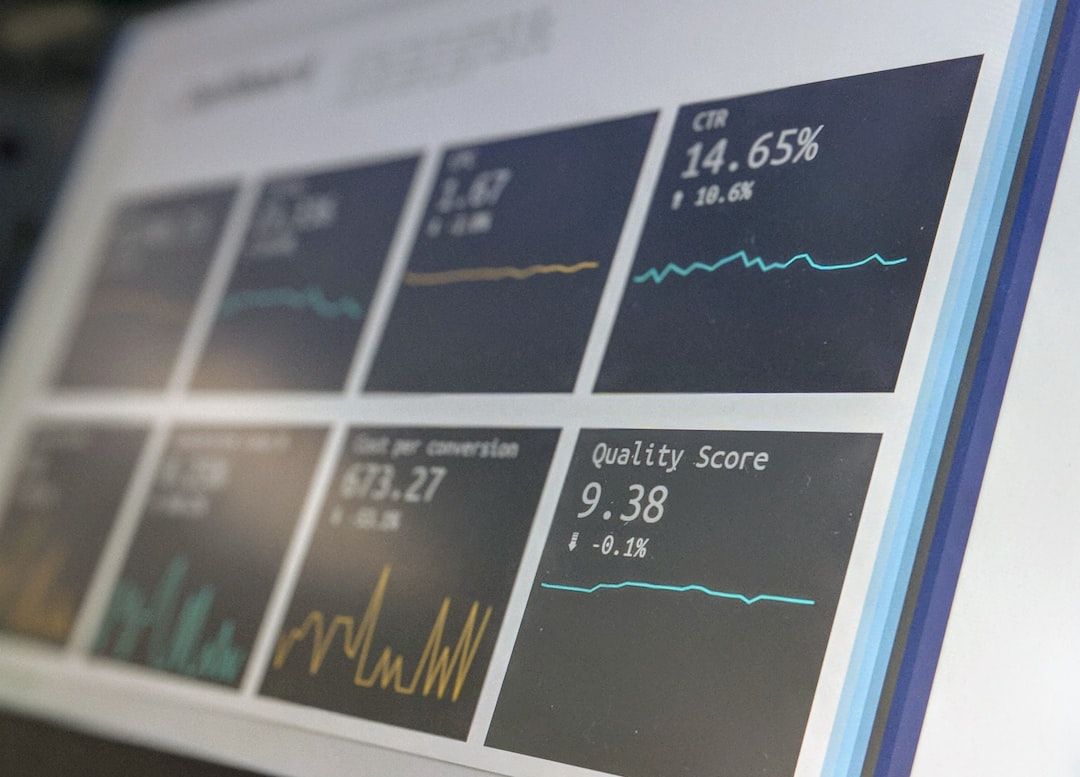
Several years ago, I wanted to have my own performance monitoring solution, so I could monitor all enterprise applications. Few enterprises implement this core cross-cutting application task across the enterprise in the same way. By the phrases “core” and “cross-cutting” I mean a feature or functionality set that touches all application development; it’s not specific to a single application. I think some functionality that is repeated across the enterprise should be done the same standard way.
Leverage logs with tools like Sumo Logic and AI to enhance security, detect threats, manage costs, and capture all your data for proactive threat prevention.
The concept of instrumentation often refers to tracing where events happen in an application. Many application performance monitoring (APM) tools use it to provide metrics on the inner workings of your application. But sometimes, all you really need are details about API calls.
In our last post, we looked at how to auto-record Amazon Interactive Video Service (Amazon IVS) live streams to an Amazon Simple Storage Service bucket.
In this article, I will cover most debugging methods, basic and modern ones, introduce some hands-on tools and show some basic configurations and instructions.
Structured metrics miss the full story. Learn how unstructured data—logs, feedback, errors—can reveal hidden issues, improving reliability and user experience
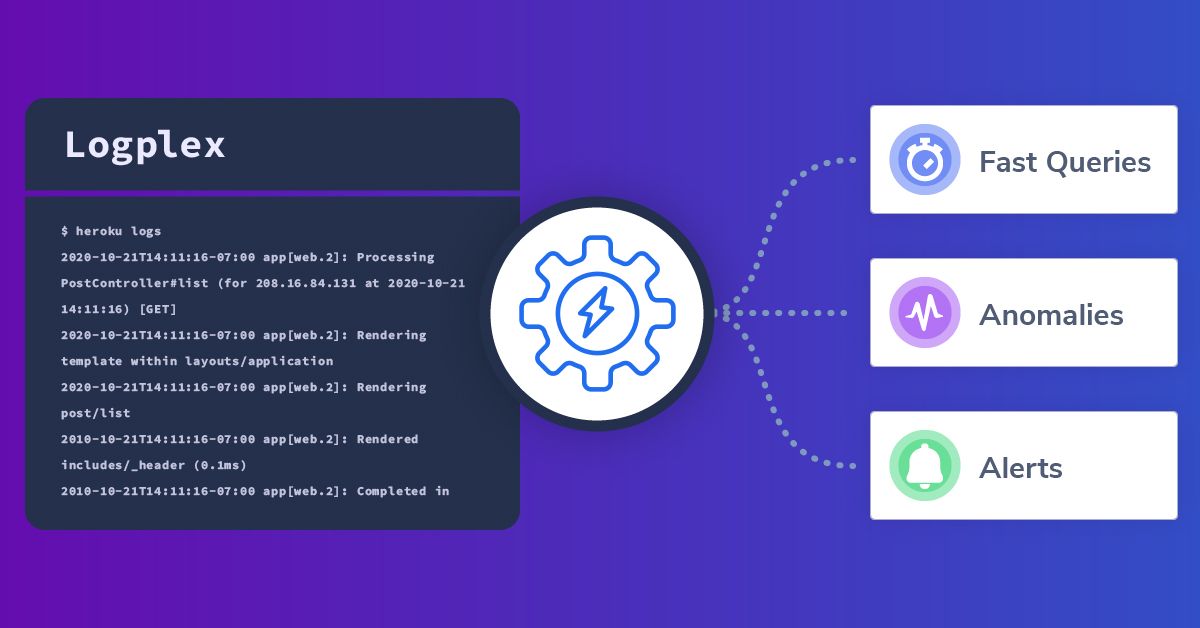
Heroku differentiates itself from other cloud providers, by offering a complete, cohesive environment. Where AWS and GCP present a decoupled toolkit, Heroku strives for a seamless, UI-driven experience for the user. This philosophy is clearly embodied in its metrics functionality, which is often a single click or basic configuration file away.
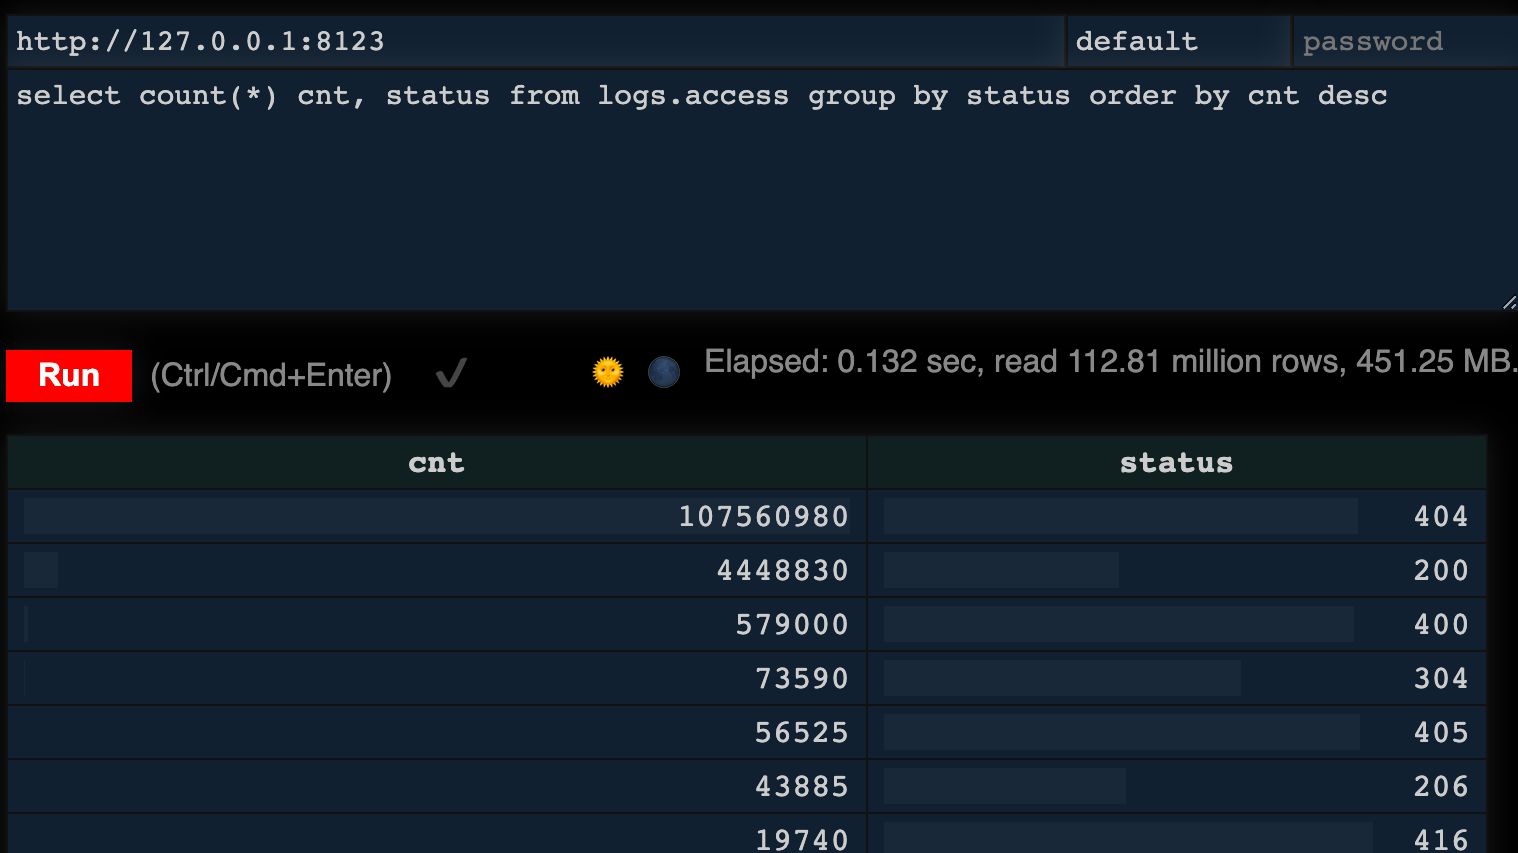
Discover how Apache Doris revolutionizes log analysis. From schema-free support to cost-effective storage, learn how to build an efficient log analysis system.
AI enhances DevSecOps by handling vast log data, automating security, and reducing alert fatigue, transforming logs into actionable insights efficiently.
Cutting log ingestion seems thrifty—until an outage happens and suddenly you really need those signals! See how zero-cost ingestion can get rid of MTTR anxiety.
In this second part of our series, we explain five additional tips to help you code more securely, from leveraging existing frameworks to protecting data.
The beginning of automated tests in a project is easy and difficult at the same time. You can start smoothly, using base architecture, simple tests and more.