Code for above image here.
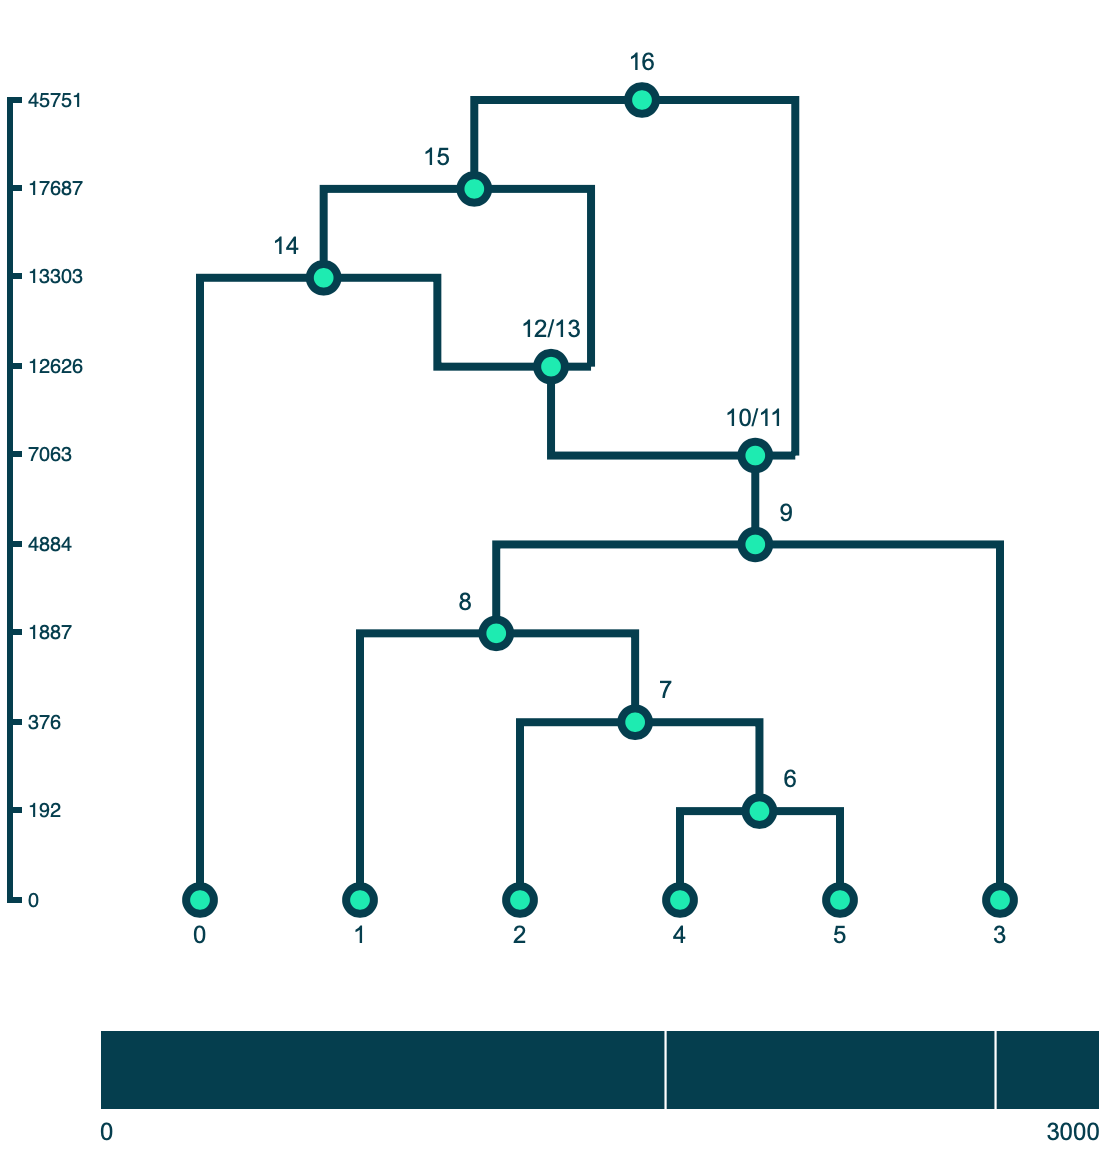
A method for drawing ancestral recombination graphs from tskit tree sequences in Python using D3.js. ARGs are plotted using a D3's force layout. All nodes have a fixed position on the y-axis set by fy. Sample nodes have a fixed position on the x-axis set by fx; the ordering of the sample nodes comes from the first tree in the tskit tree sequence (this is not always the optimal ordering but is generally a good starting point for plotting). The x positions of other nodes are set by a force simulation where all nodes repel each other countered by a linkage force between connected nodes in the graph.
Users can click and drag the nodes (including the sample) along the x-axis to further clean up the layout of the graph. The simulation does not take into account line crosses, which can often be improved with some fiddling. Once a node has been moved by a user, its position is fixed with regards to the force simulation.
See tutorial.md for a walkthrough of the package.
This repository now includes:
- Python tests (pytest), under
tests/ - Minimal browser smoke tests (Playwright), under
tests/playwright/
- Install Python dependencies and test runner:
python -m pip install --upgrade pip
pip install -e .
pip install pytest- Install Playwright tooling:
npm install
npx playwright install --with-deps chromium- Run tests:
python -m pytest tests/ -q
npm run test:e2eCI is defined in .github/workflows/ci.yml and runs both:
python -m pytest tests/ -qnpm run test:e2e
If commands change locally, update them in both this README and the workflow file so local and CI behavior stay aligned.