PhonePe pulse analysis app build in streamilt using library is streamlit as st pandas as pd json sqlalchemy in create_engine pandas.io in sql pymysql plotly.express as px plotly.io as pio
PhenePe Pulse Analysis main page as

It is used a 2018 to 2022 data it available for more then 10 filter functions User count, User Transections
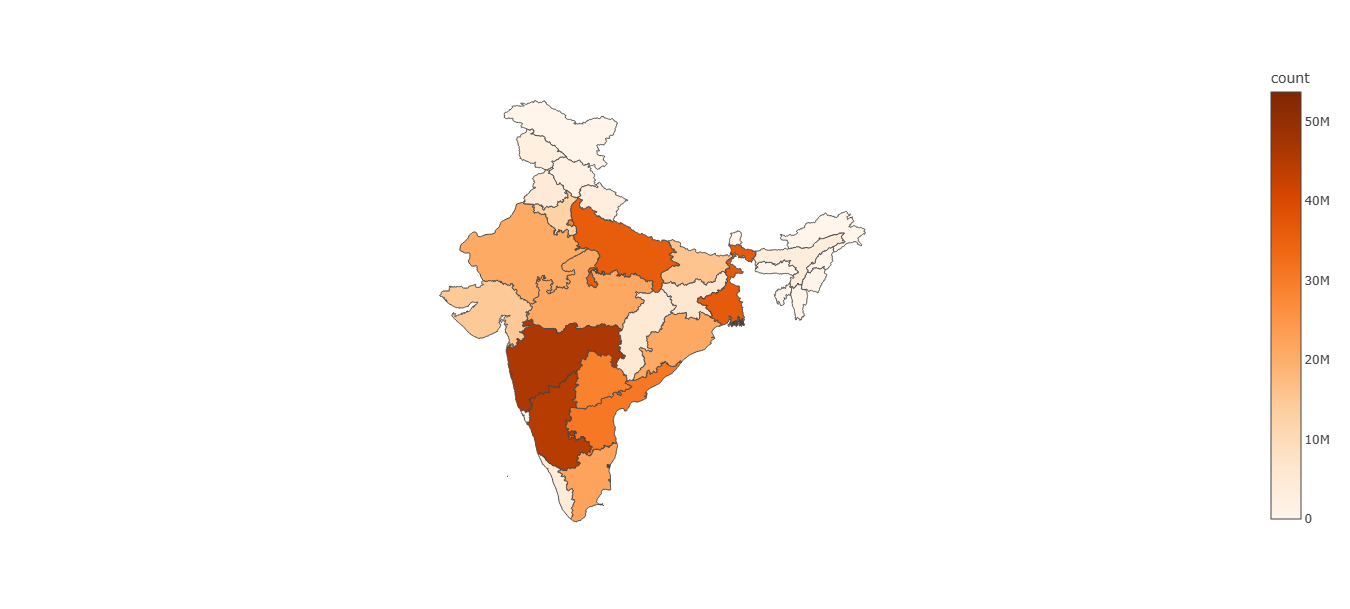
Geo-Graphical Map
Geo Graphical map is show a transection of states total amount or total count of users in year wise and quarter wise
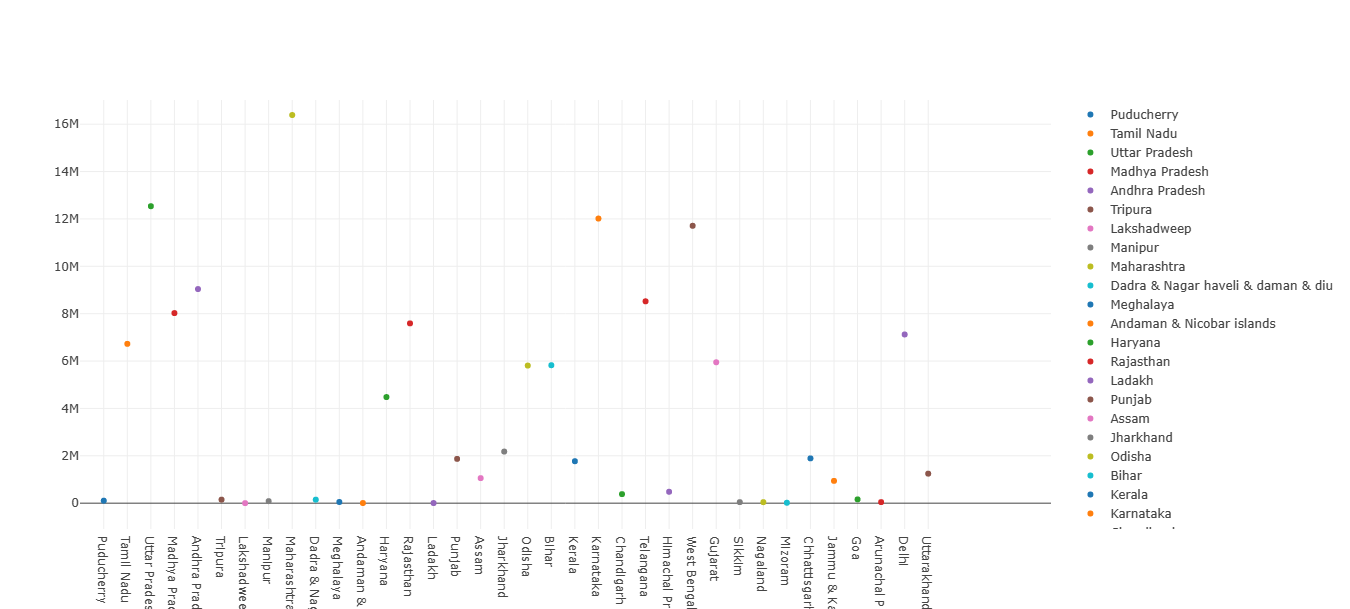
Scatter Plot chat
Scatter Plot also show a transection of states total amount and total count of users in year wise and quarter wise
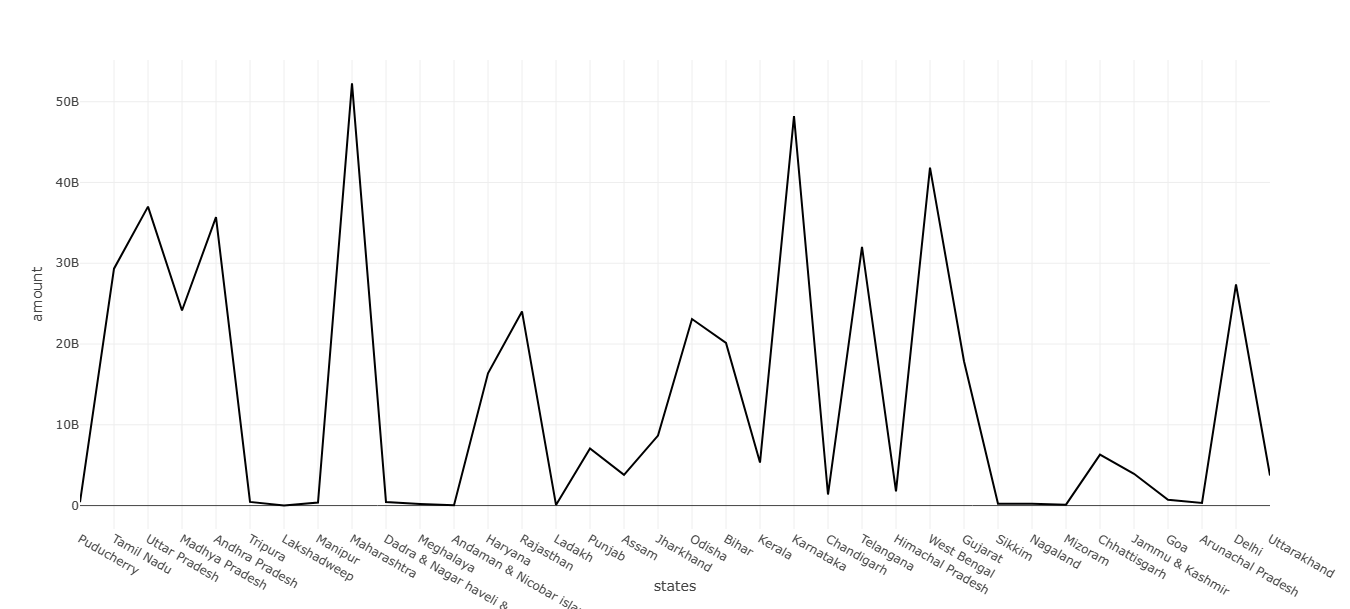
Line Graph
Line Graph show a transection of states total amount or total count of users in year wise and quarter wise